Imagining a Dashboard for Managing Athletic Organizations
Creating a landing page dashboard with actionable registration and financial insights for sports admin to guide decision making.
Role
Owned the UX/UI for this 3 month project following PlayerFirst's founding designer's preliminary iterations.
Involved
Data Visualization, Competitive Analysis, Interaction Design, Web Design
Product Collaborations
Kadie - UX Manager, Jessi - Product Manager, Chad - Chief Strategy Officer
Development Team
Jarrett - Chief Technology Officer, Patrick & Matthew - Software Engineers
1 Problem
A Management Platform Lacking an Overall Status Check
PlayerFirst is a web application that supports youth sports organizations’ registration, scheduling, and more.
The platform desperately needed a central landing page that synthesized this info scattered across various tabs. With this insights immediately accessible, admin and coaches could quickly check in on how their brands were performing and take necessary action.
What Users Are Saying…

Admin
"PlayerFirst holds all of my brands' information in one place, but I have to jump across the site to ensure each area of my business is running smoothly."

Coaches
"I'm not just a coach for single team. I oversee tryouts and registration for teams of different ages, skill levels, and genders so I need a place where I can check the pulse on this quickly."
Providing Insights from a Landing Page Dashboard
To better inform admin and coaches after they login to the PlayerFirst management platform, stakeholders decided to reimagine the landing page. In its place would be a multi-tab dashboard that orients the user by visualizing short and long term organizational insights.
The dashboard was initially collaboratively designed alongside the design manager, Kadie, but in its final stages it was handed over to me to own.
Project Question
How might we summarize registration and financial insights to guide athletic organizations' decision making?

Project Overview
Part 1
Creating a Multi-Tab Landing Page Dashboard
Creating a comprehensive dashboard with consistent visualization components to communicate long and short term insights.
Part 2
Geographical Analysis via Interactive Heat Map
Imagining a heat map dashboard tab that visualizes organization performance by state, county, city, or zip code.
2 Creating a Multi-Tab Landing Page Dashboard
Analyzing the First Dashboard Iteration
With a goal to create a component-optimized second iteration of the dashboard, I would work alongside PlayerFirst's design manager who created the first iteration.
The dashboard would need to provide admin with both long-term and short-term insights to help coaches understand their organization's overall progress and most recent updates. By providing these insights upon login, admin would be prompted to analyze the current state of the many areas of the PlayerFirst athletic management platform.
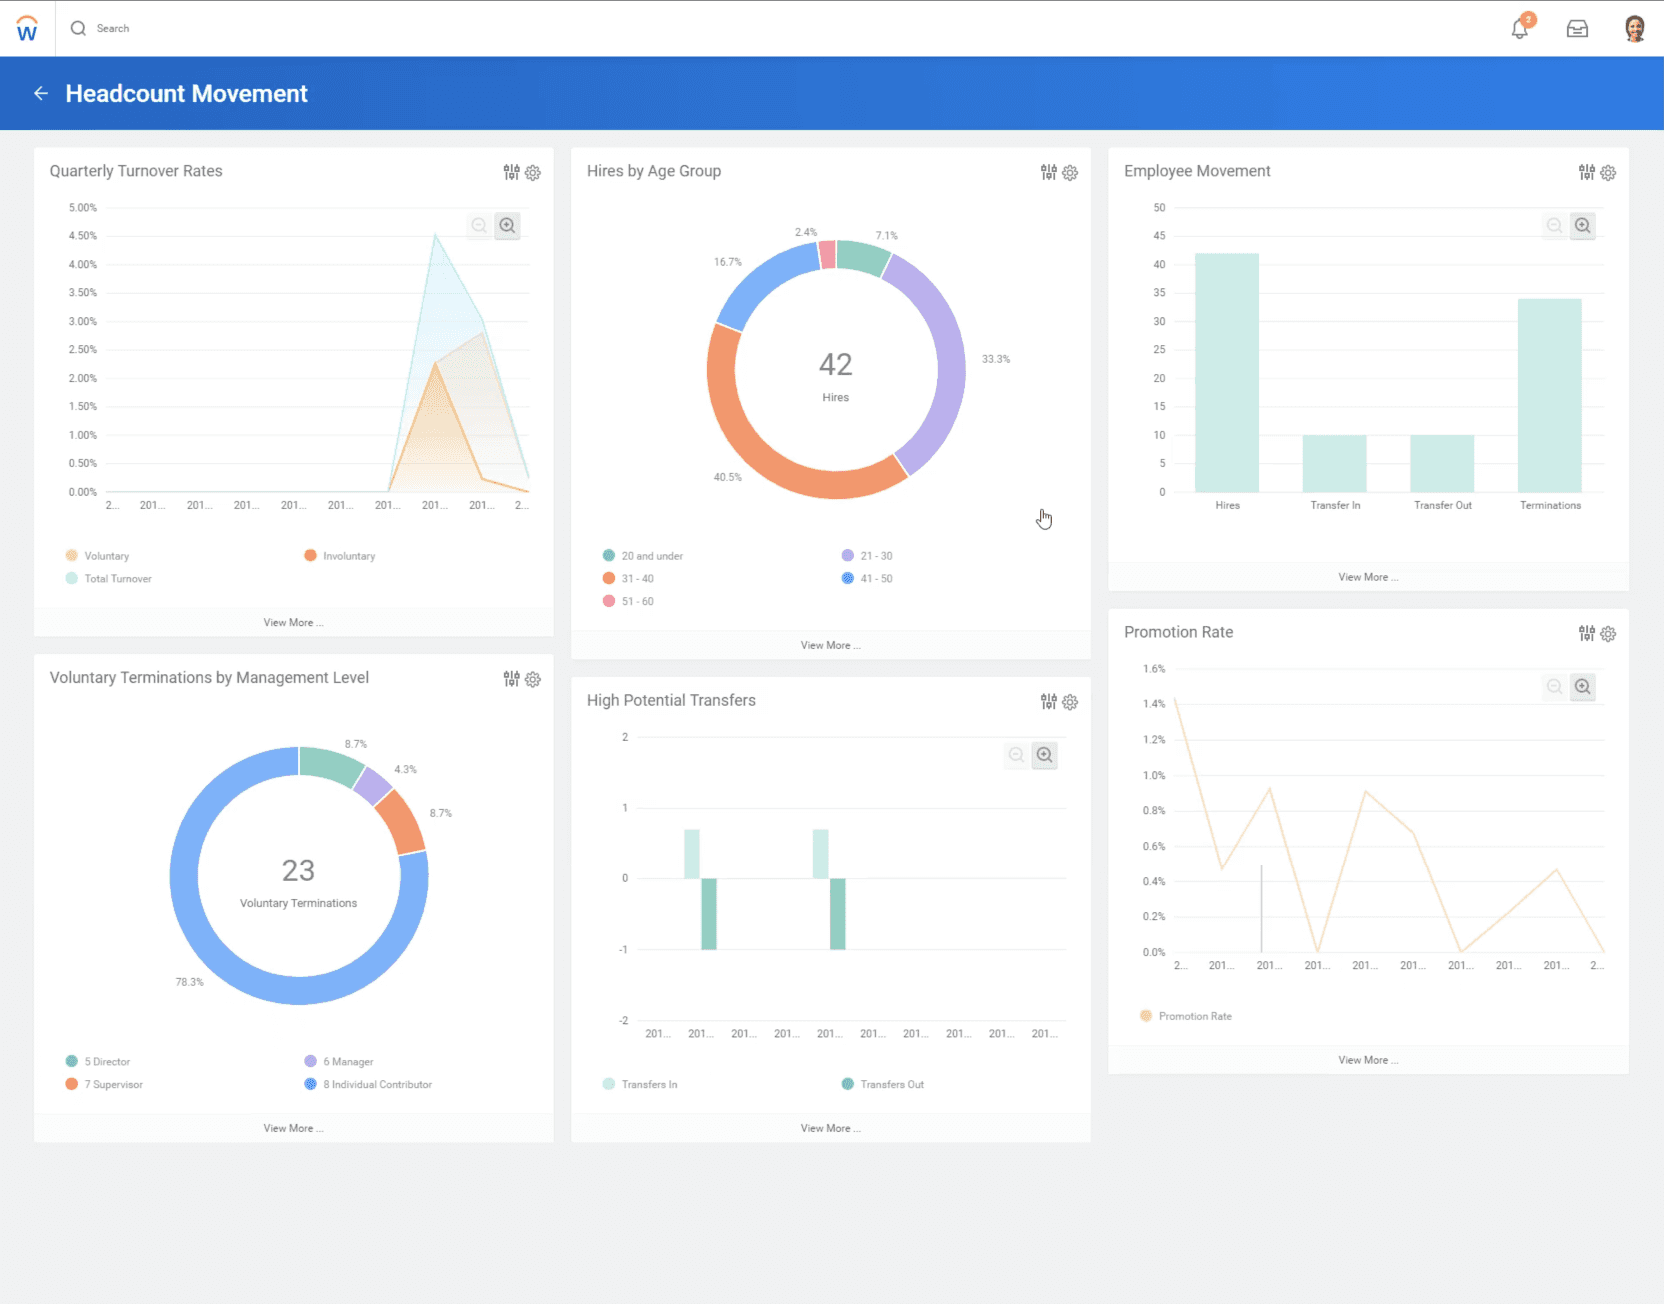
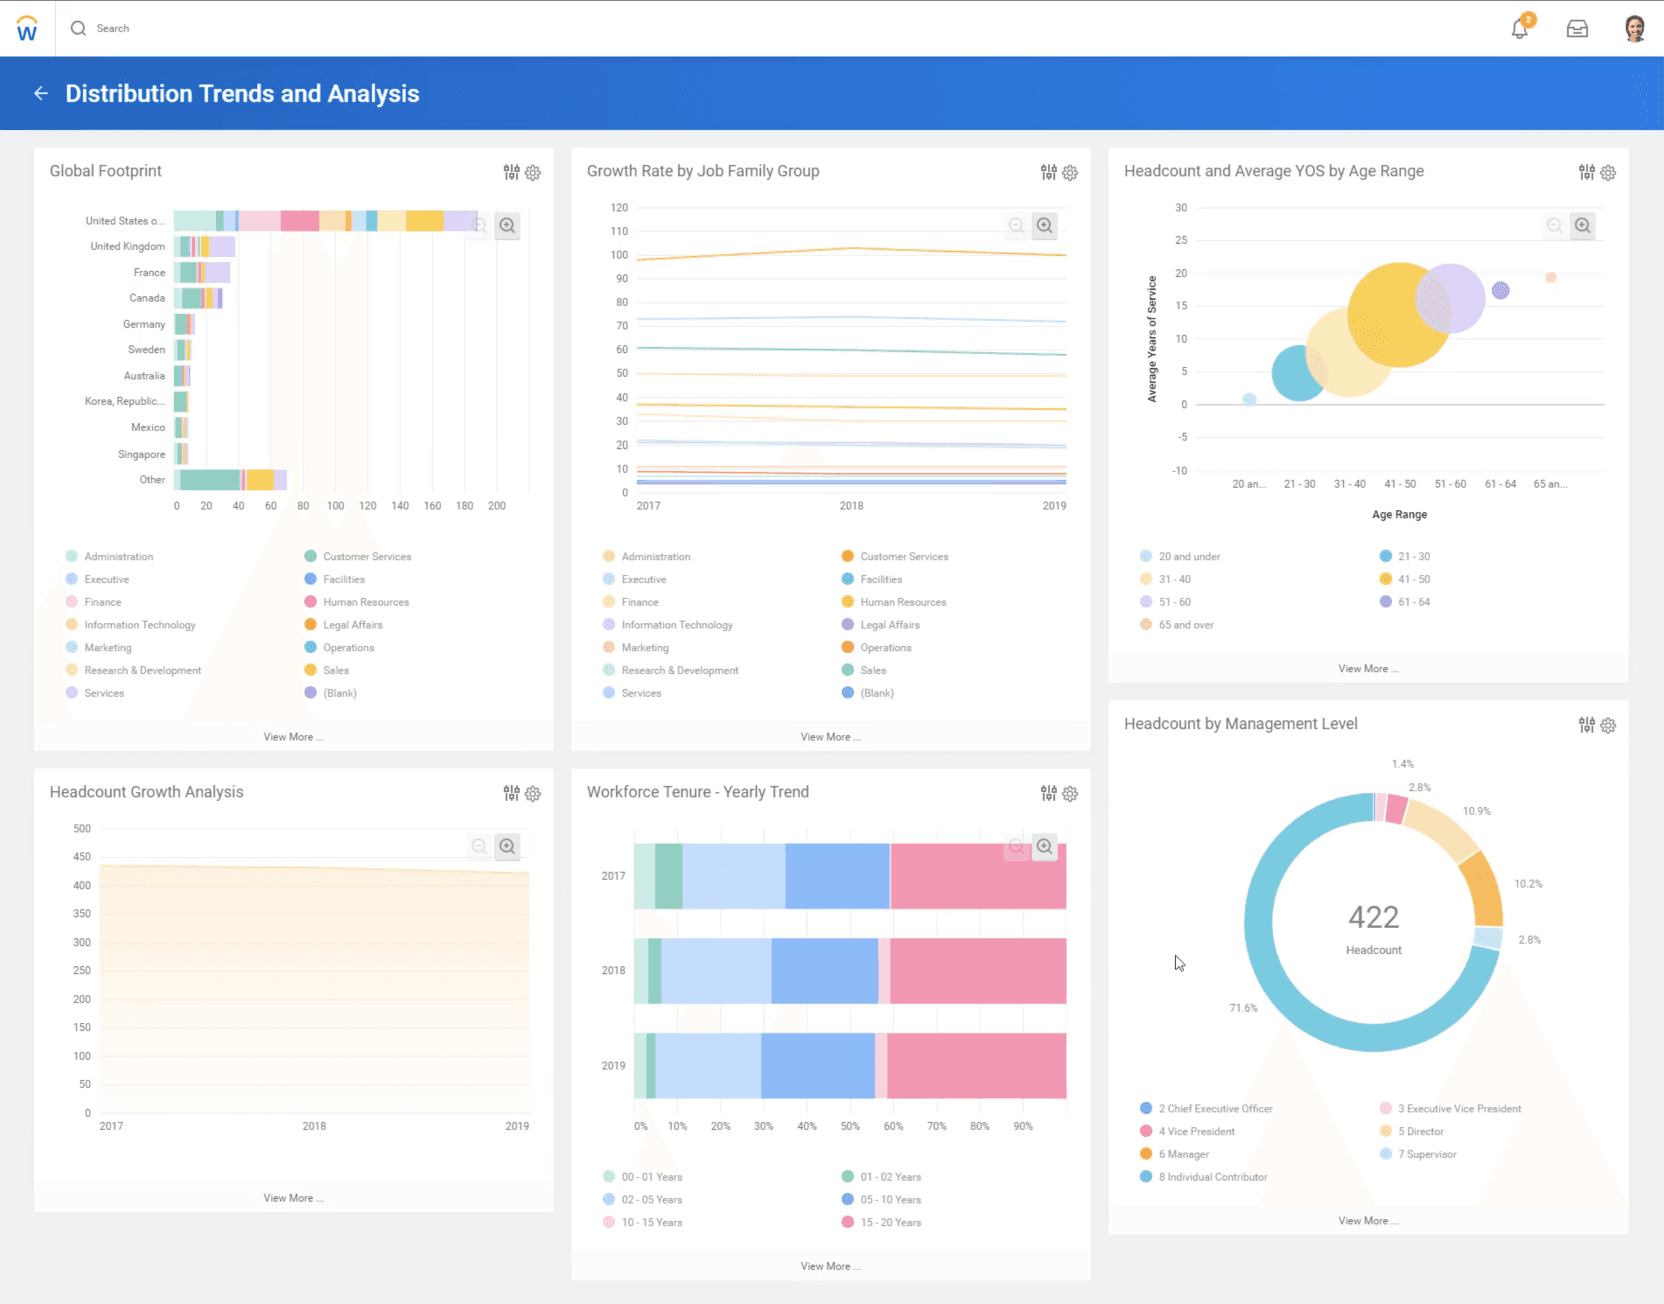
Taking Inspiration from Workday's Dashboard Tiles
Prior to my joining the company, Kadie, the design manager, created her first iteration with Workday's existing dashboards as a key inspiration . Stakeholders particularly admired the clear information hierarchy seen in the donut charts. By using the tile approach, we could create a dashboard that addresses the many topics surrounding athletics management in detail.
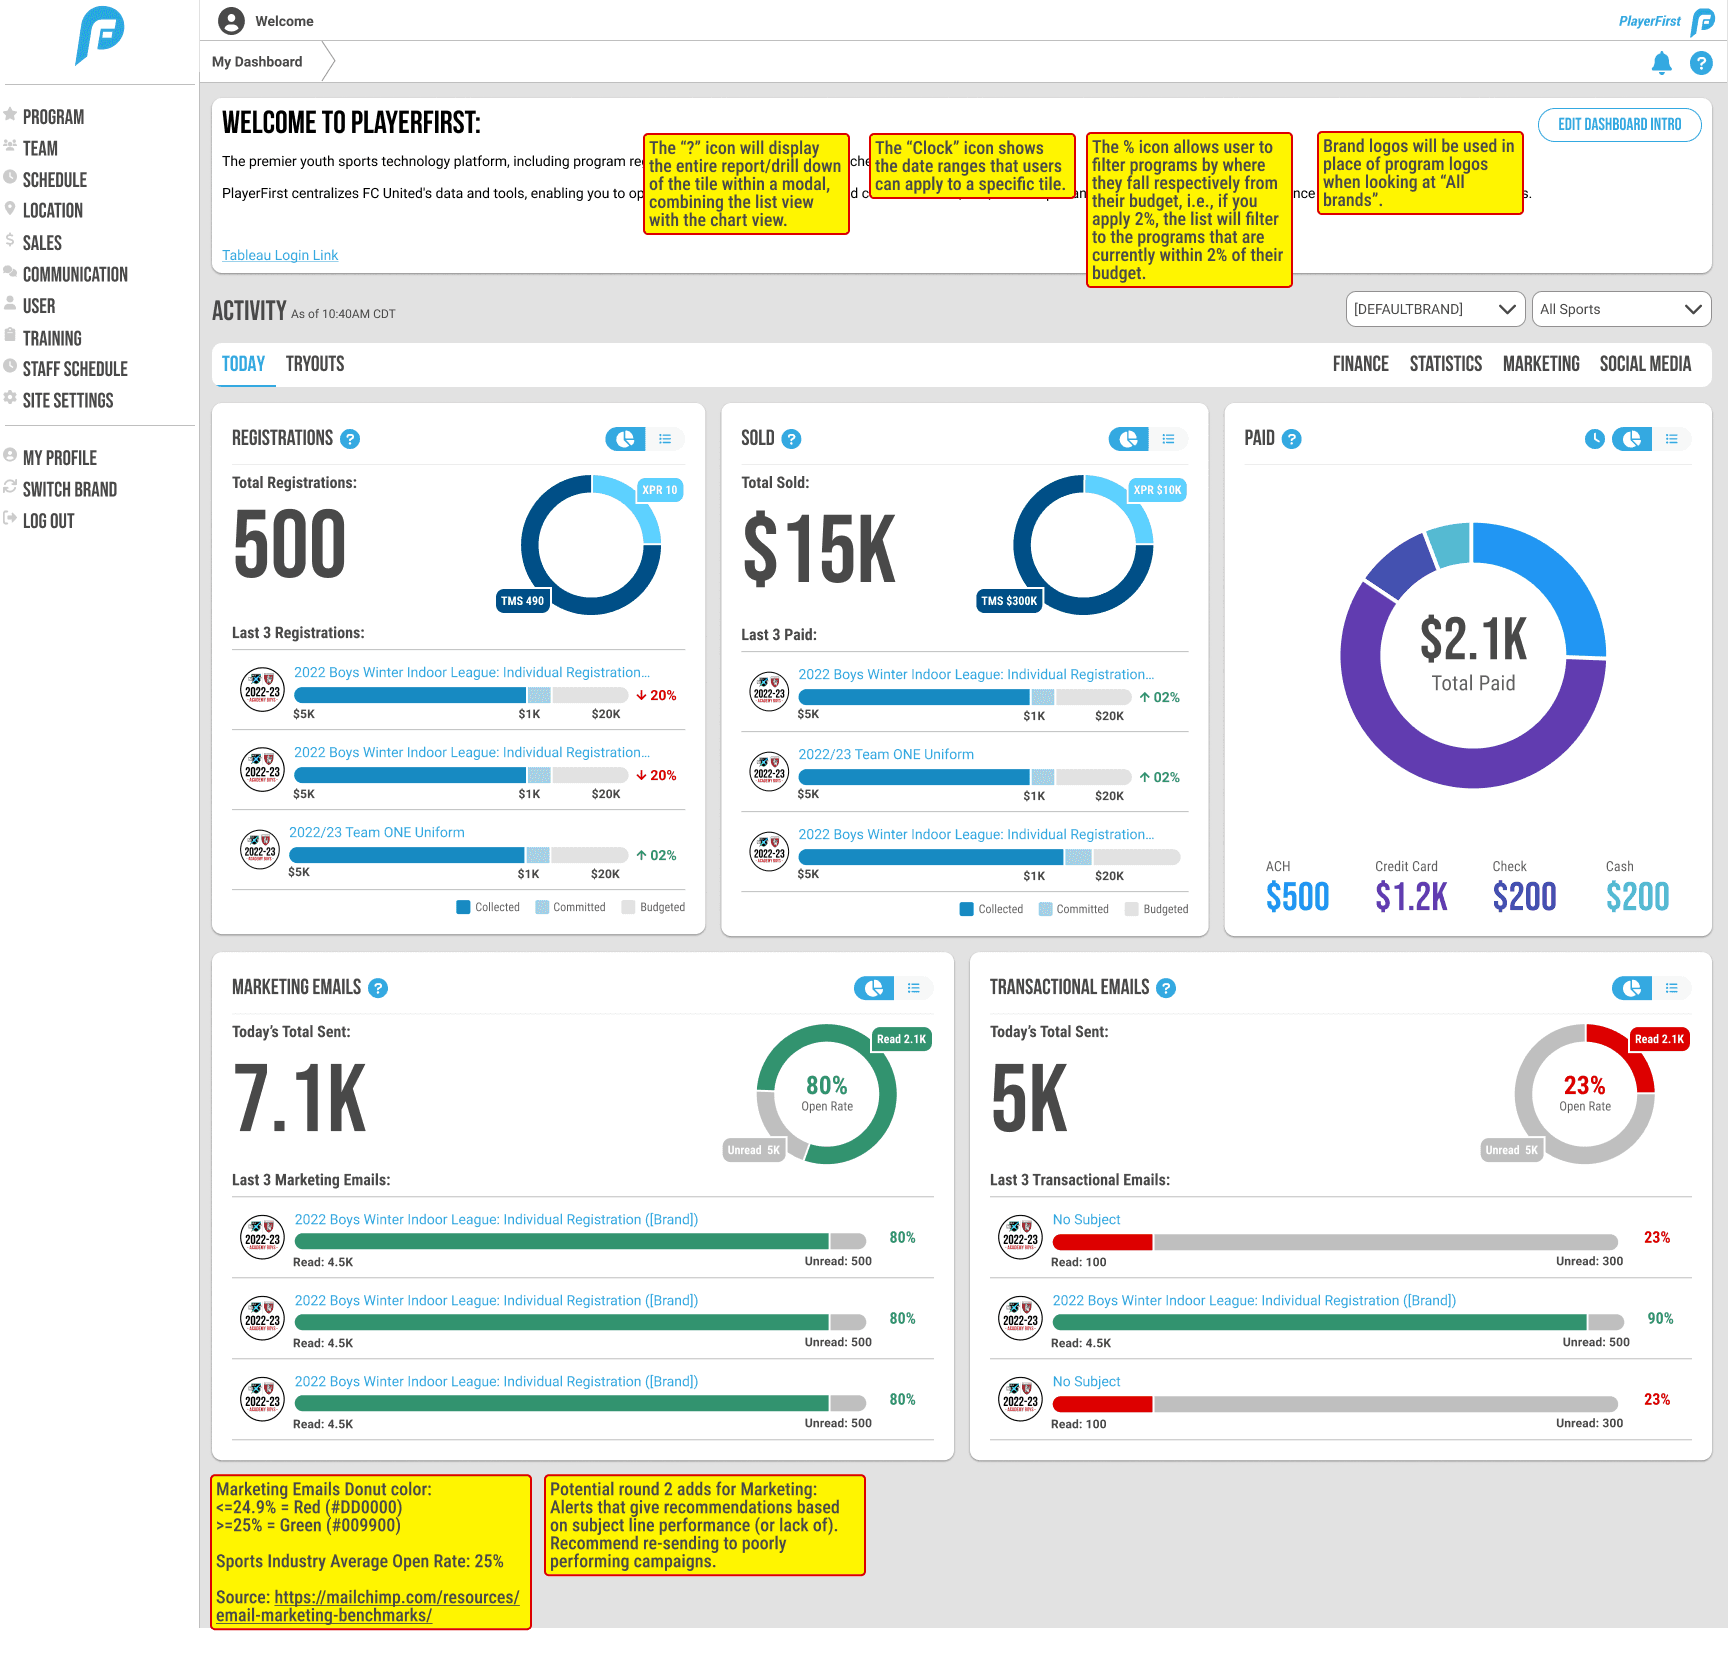
Starting Point
Starting from the Founding Designer's Dashboard First Iteration
Kadie's first iteration set up a solid direction for the look and feel of the dashboard. However, after speaking with the CTO, we moved forward with the goal of more closely aligning each tile's visualization components to reduce development complexity. Furthermore, stakeholders provided ideas for new tiles to add to the dashboard.
Creating Consistent & Actionable Visualization Components
Before designing the full wireframes for the second iteration, I built a streamlined visualization component library.
This made it easier to quickly implement stakeholder requests. The first iteration used a makeshift library, so improving this system was a key goal for the second iteration.
Visualization Components
We created a master tile component with a space to drop in a visualization, which would automatically scale through Figma constraints and auto-layout. Micro components such as keys or rate of change labels were leveraged for even more consistency.
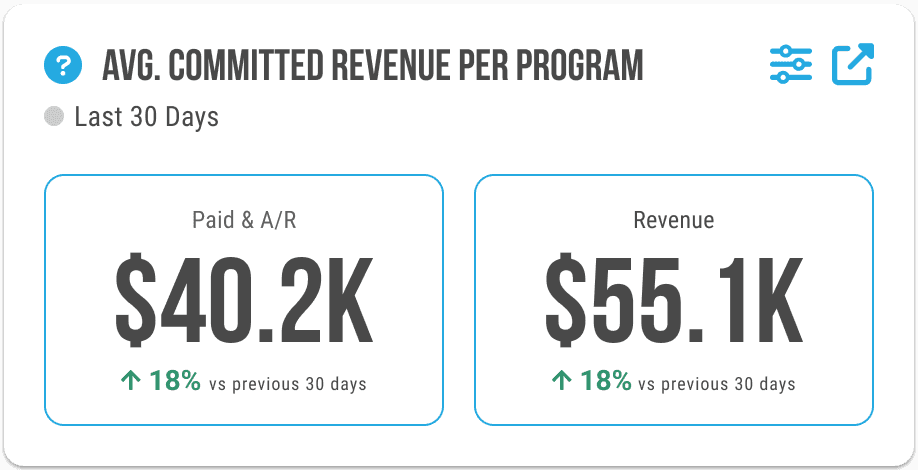
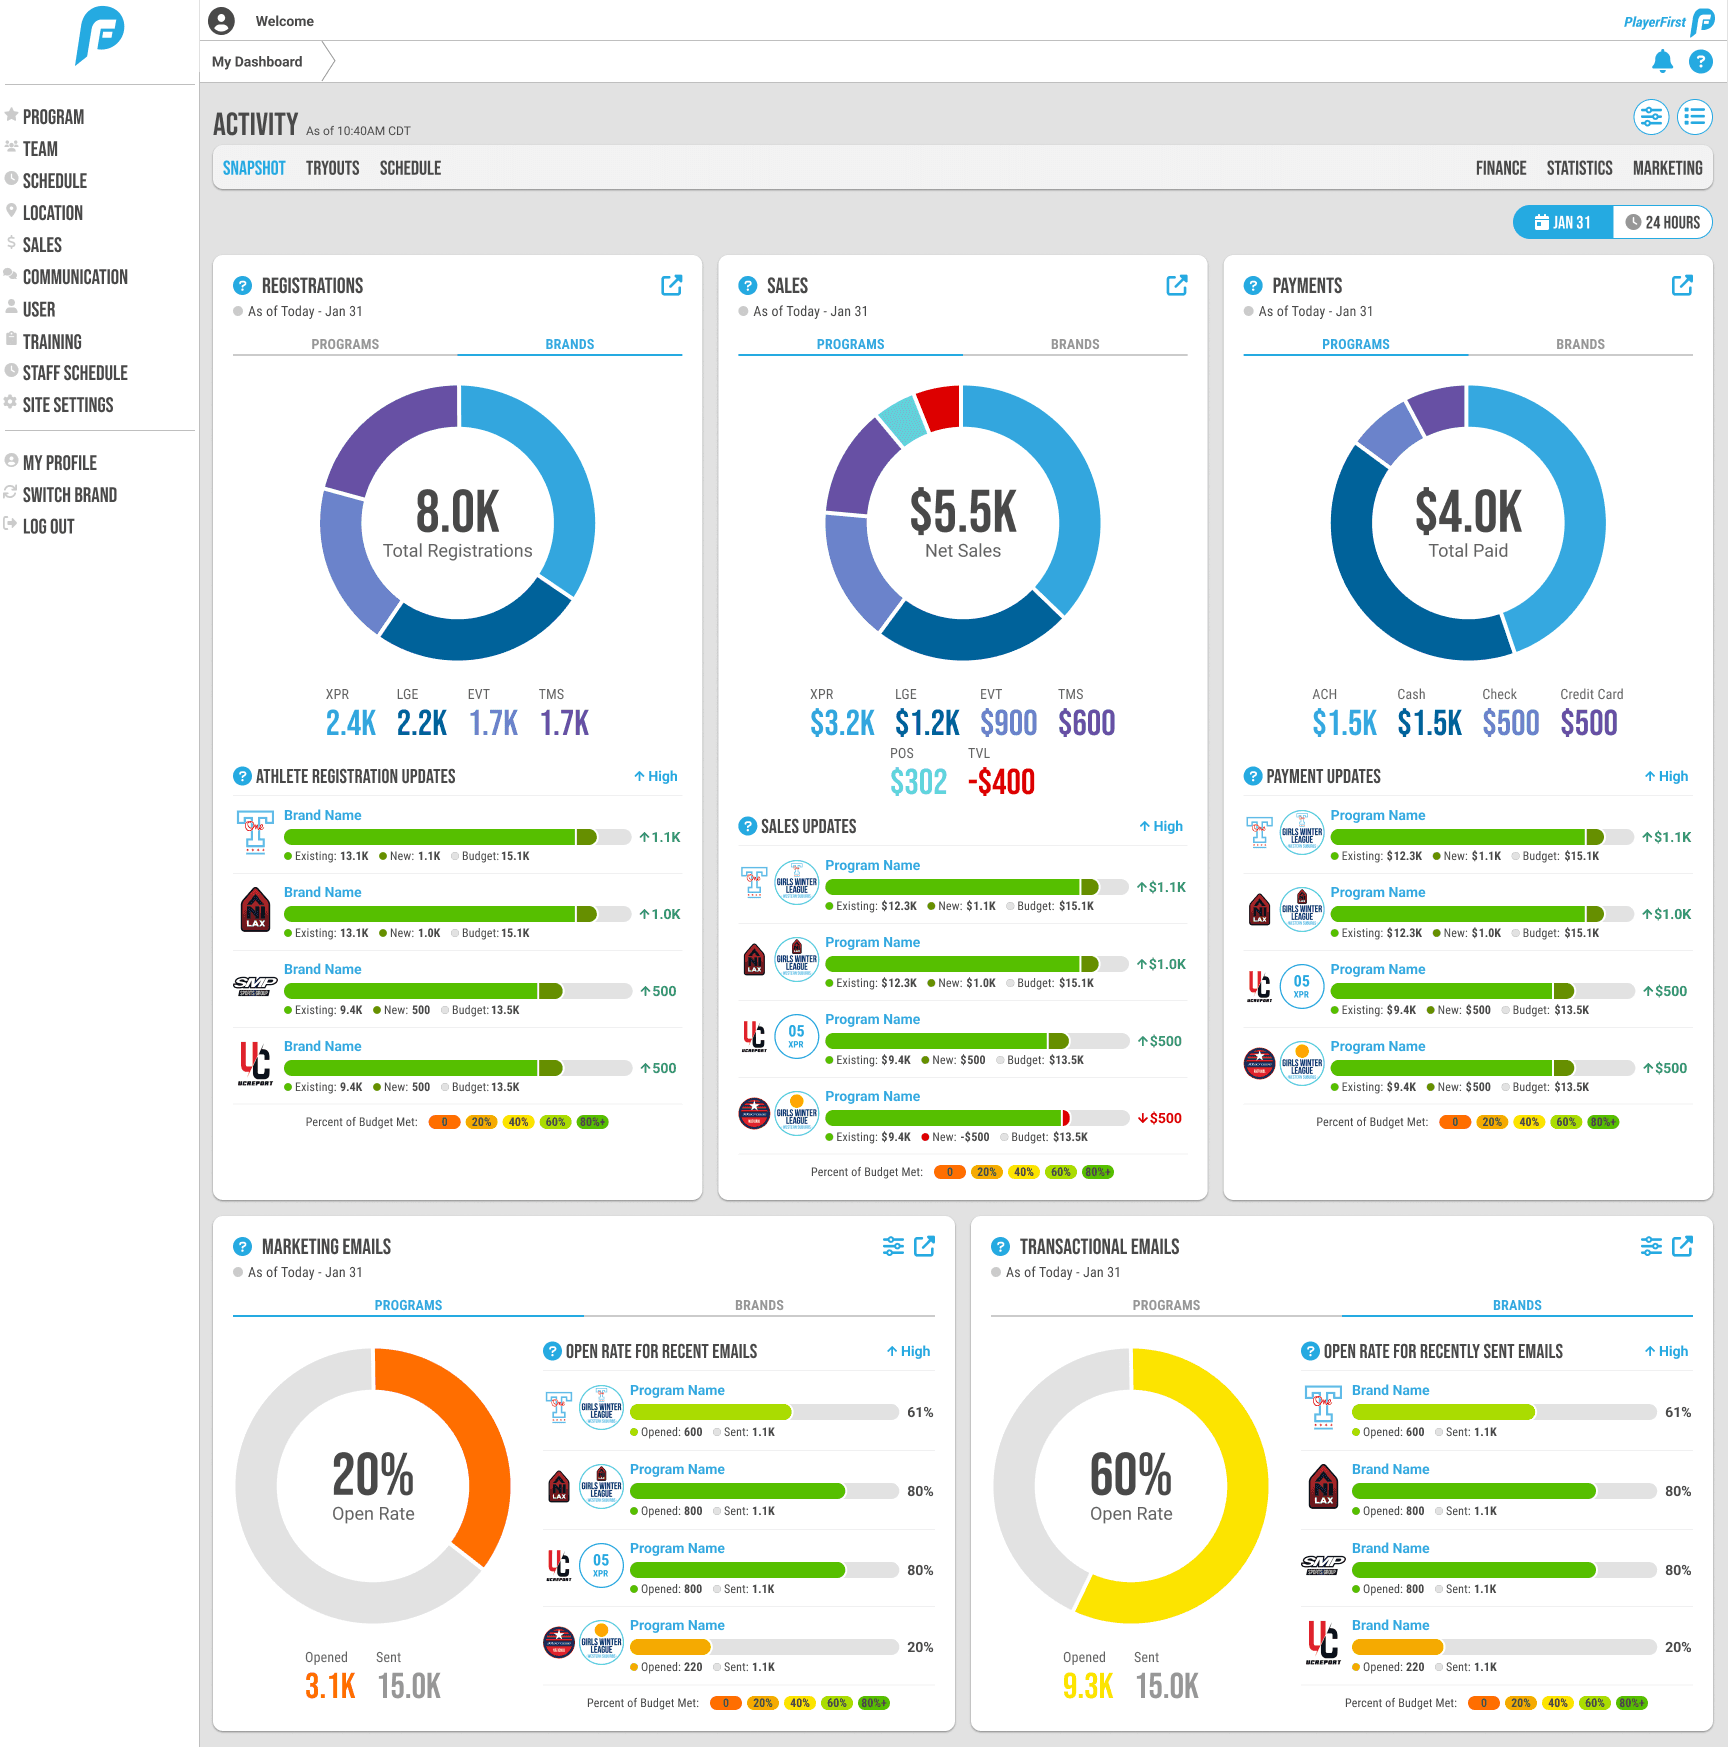
Unit Economics Callouts
Related averages are grouped in a tile, with color coded rate of changes labeled conveniently below.
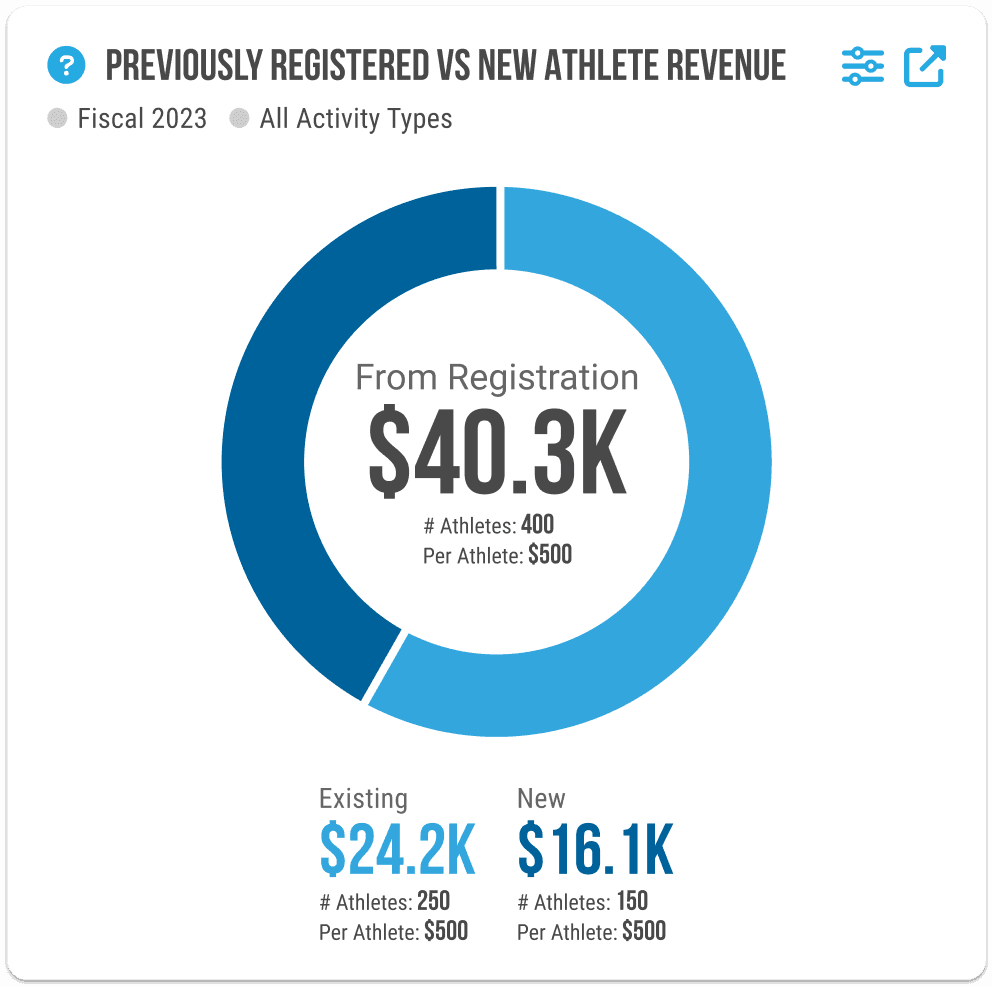
Donut Chart
Pie charts allow totals to be broken down into subtotals. A clear information hierarchy is created using color and type size. A cool color palette unifies the subsections to convey that they make a whole. This pie chart would be leveraged consistently rather than having two forms as it did in the first iteration
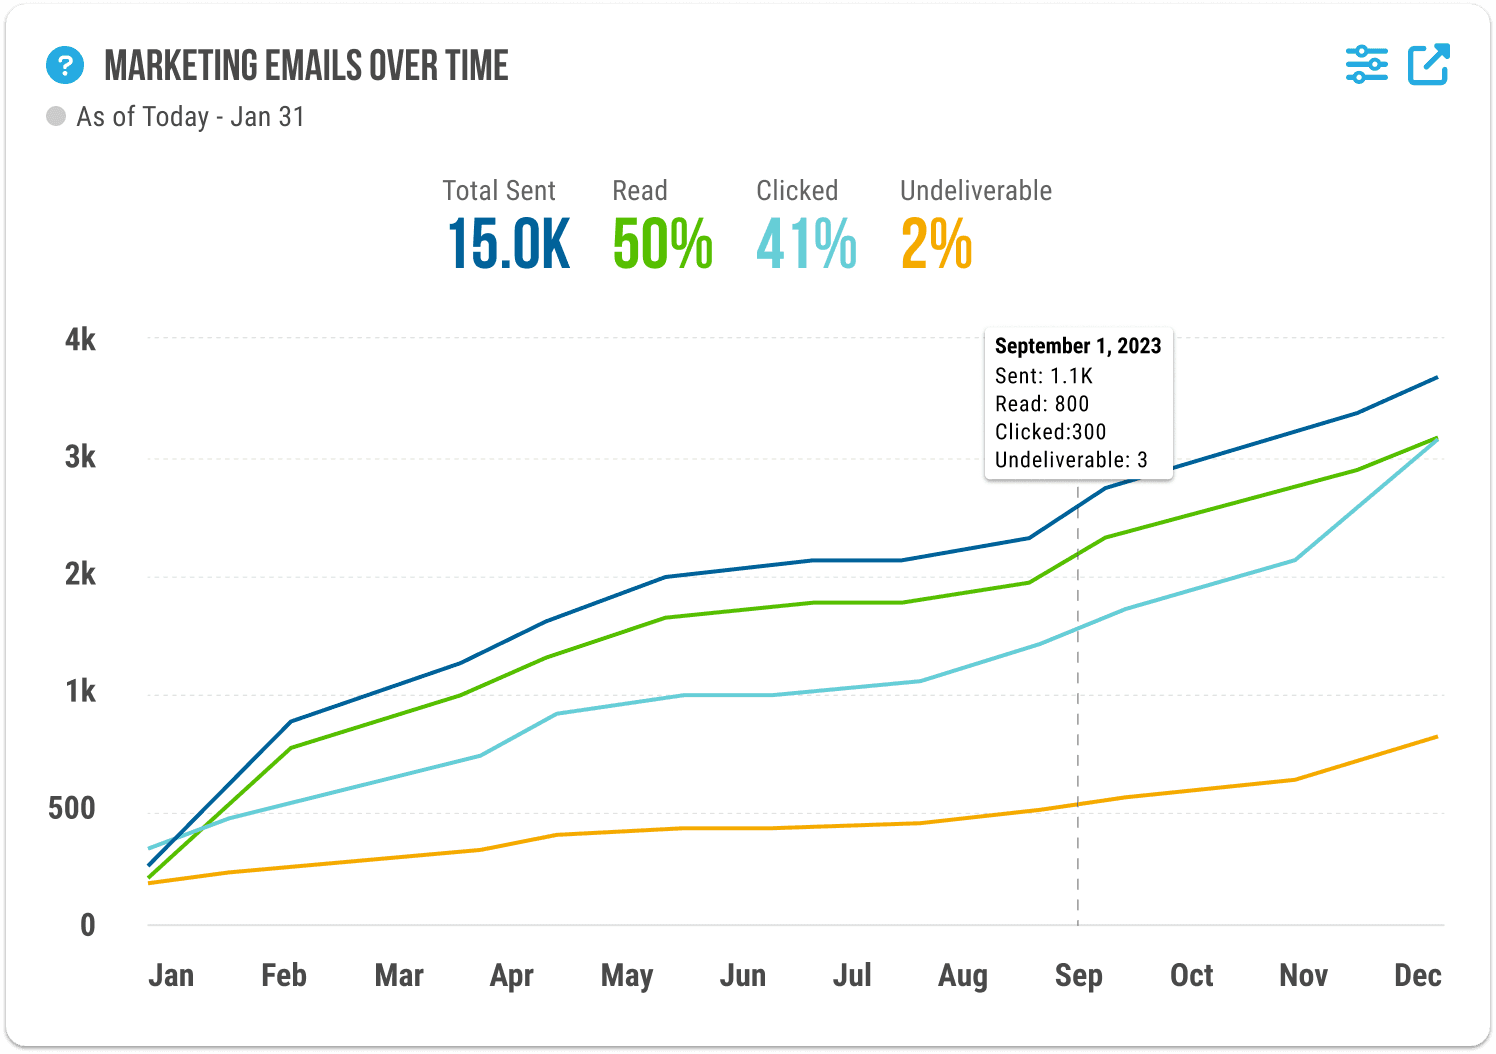
Line Graph
Different factors are graphed over time using a line chart. A distinct color pallette is employed to allow these lines to overlap and still be distinguished from each other.
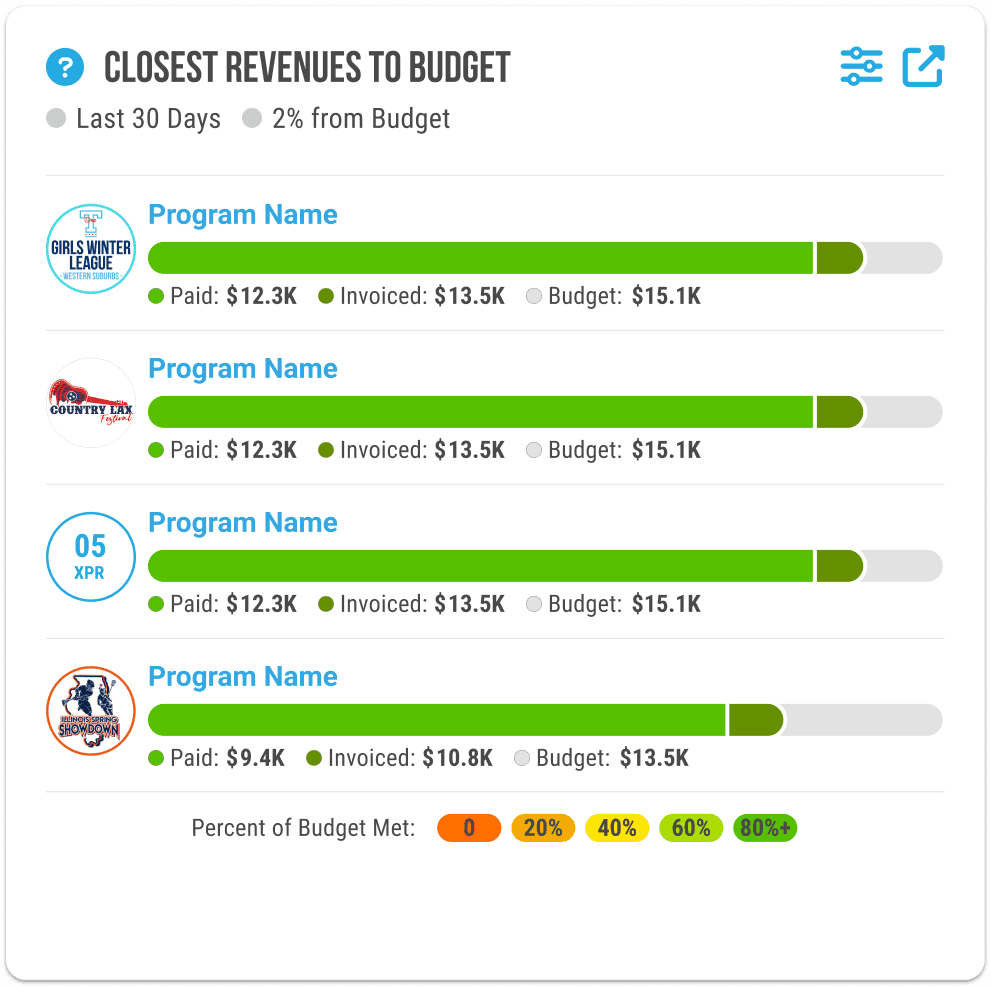
List Item Bar Chart
Individual program and brand performance are visualized using a horizontal stacked bar chart. Increases are labeled in a darker tint, while goals are shown with a light gray background.
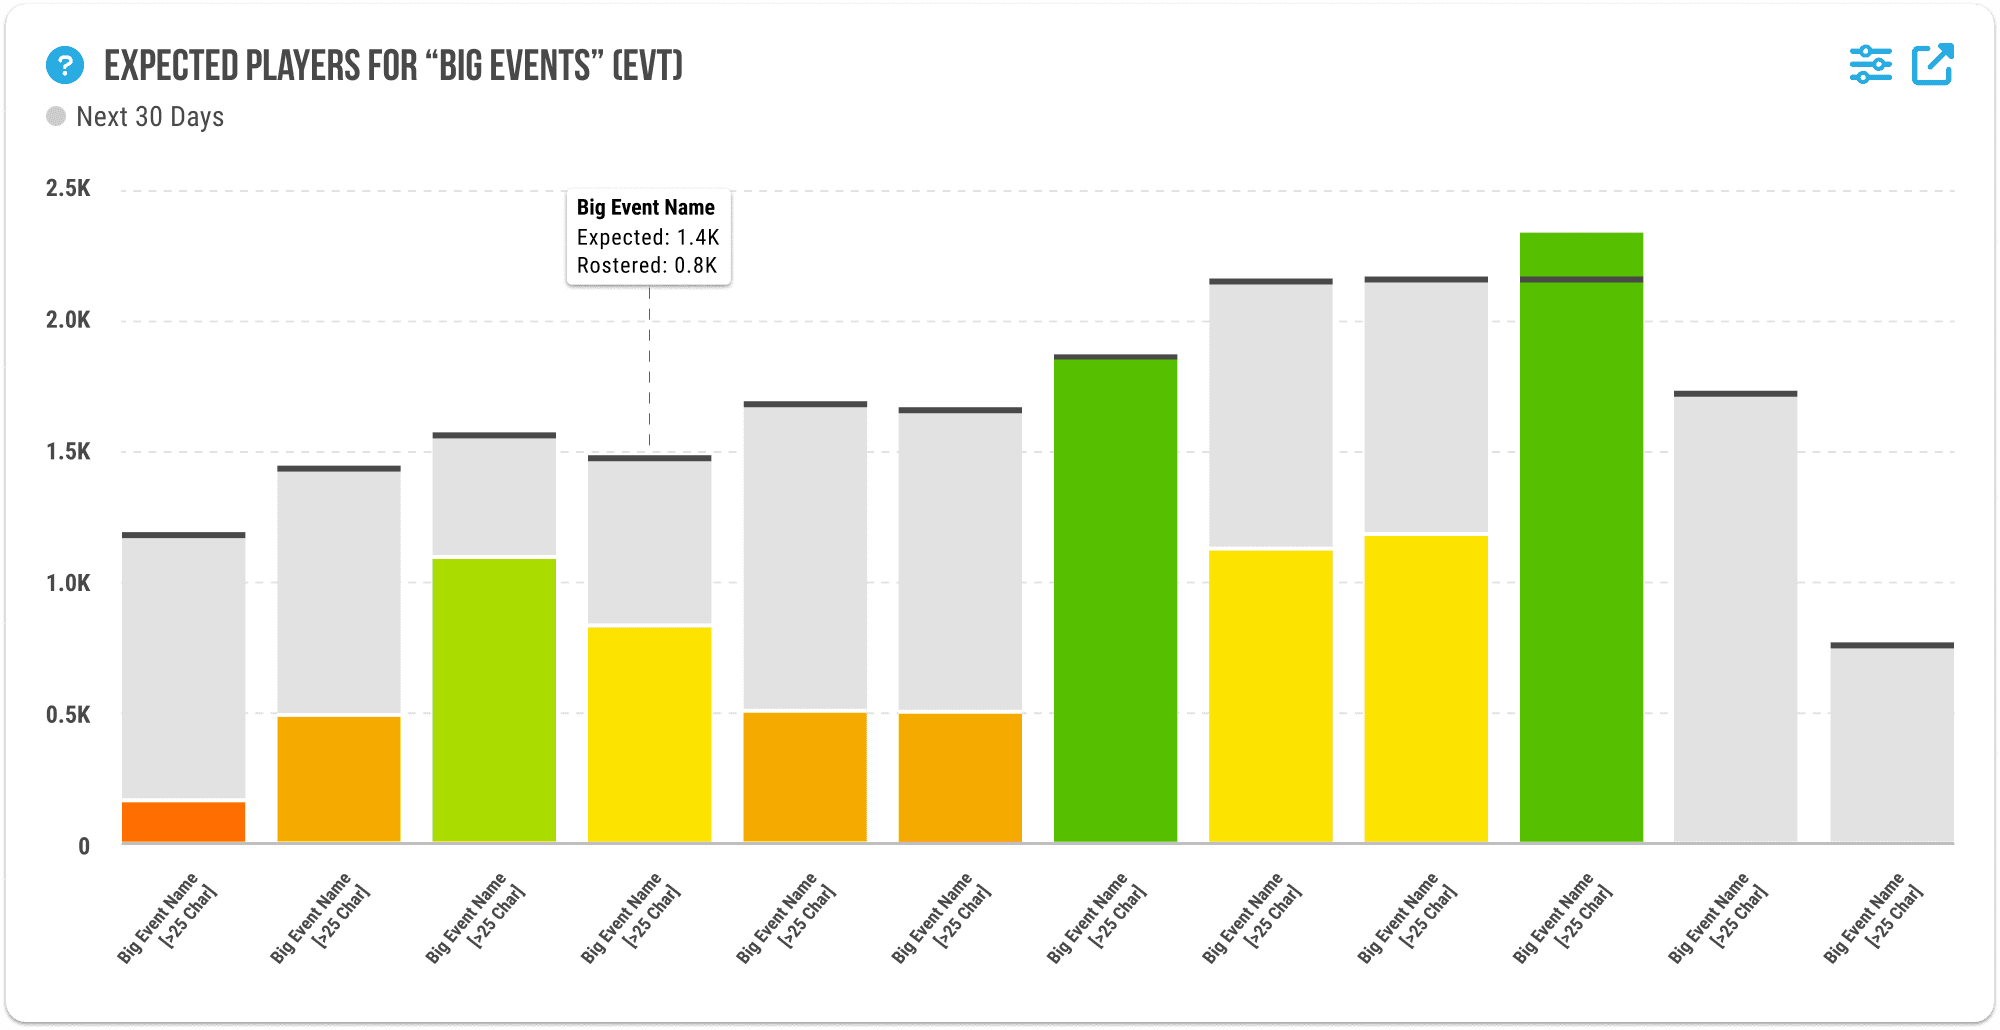
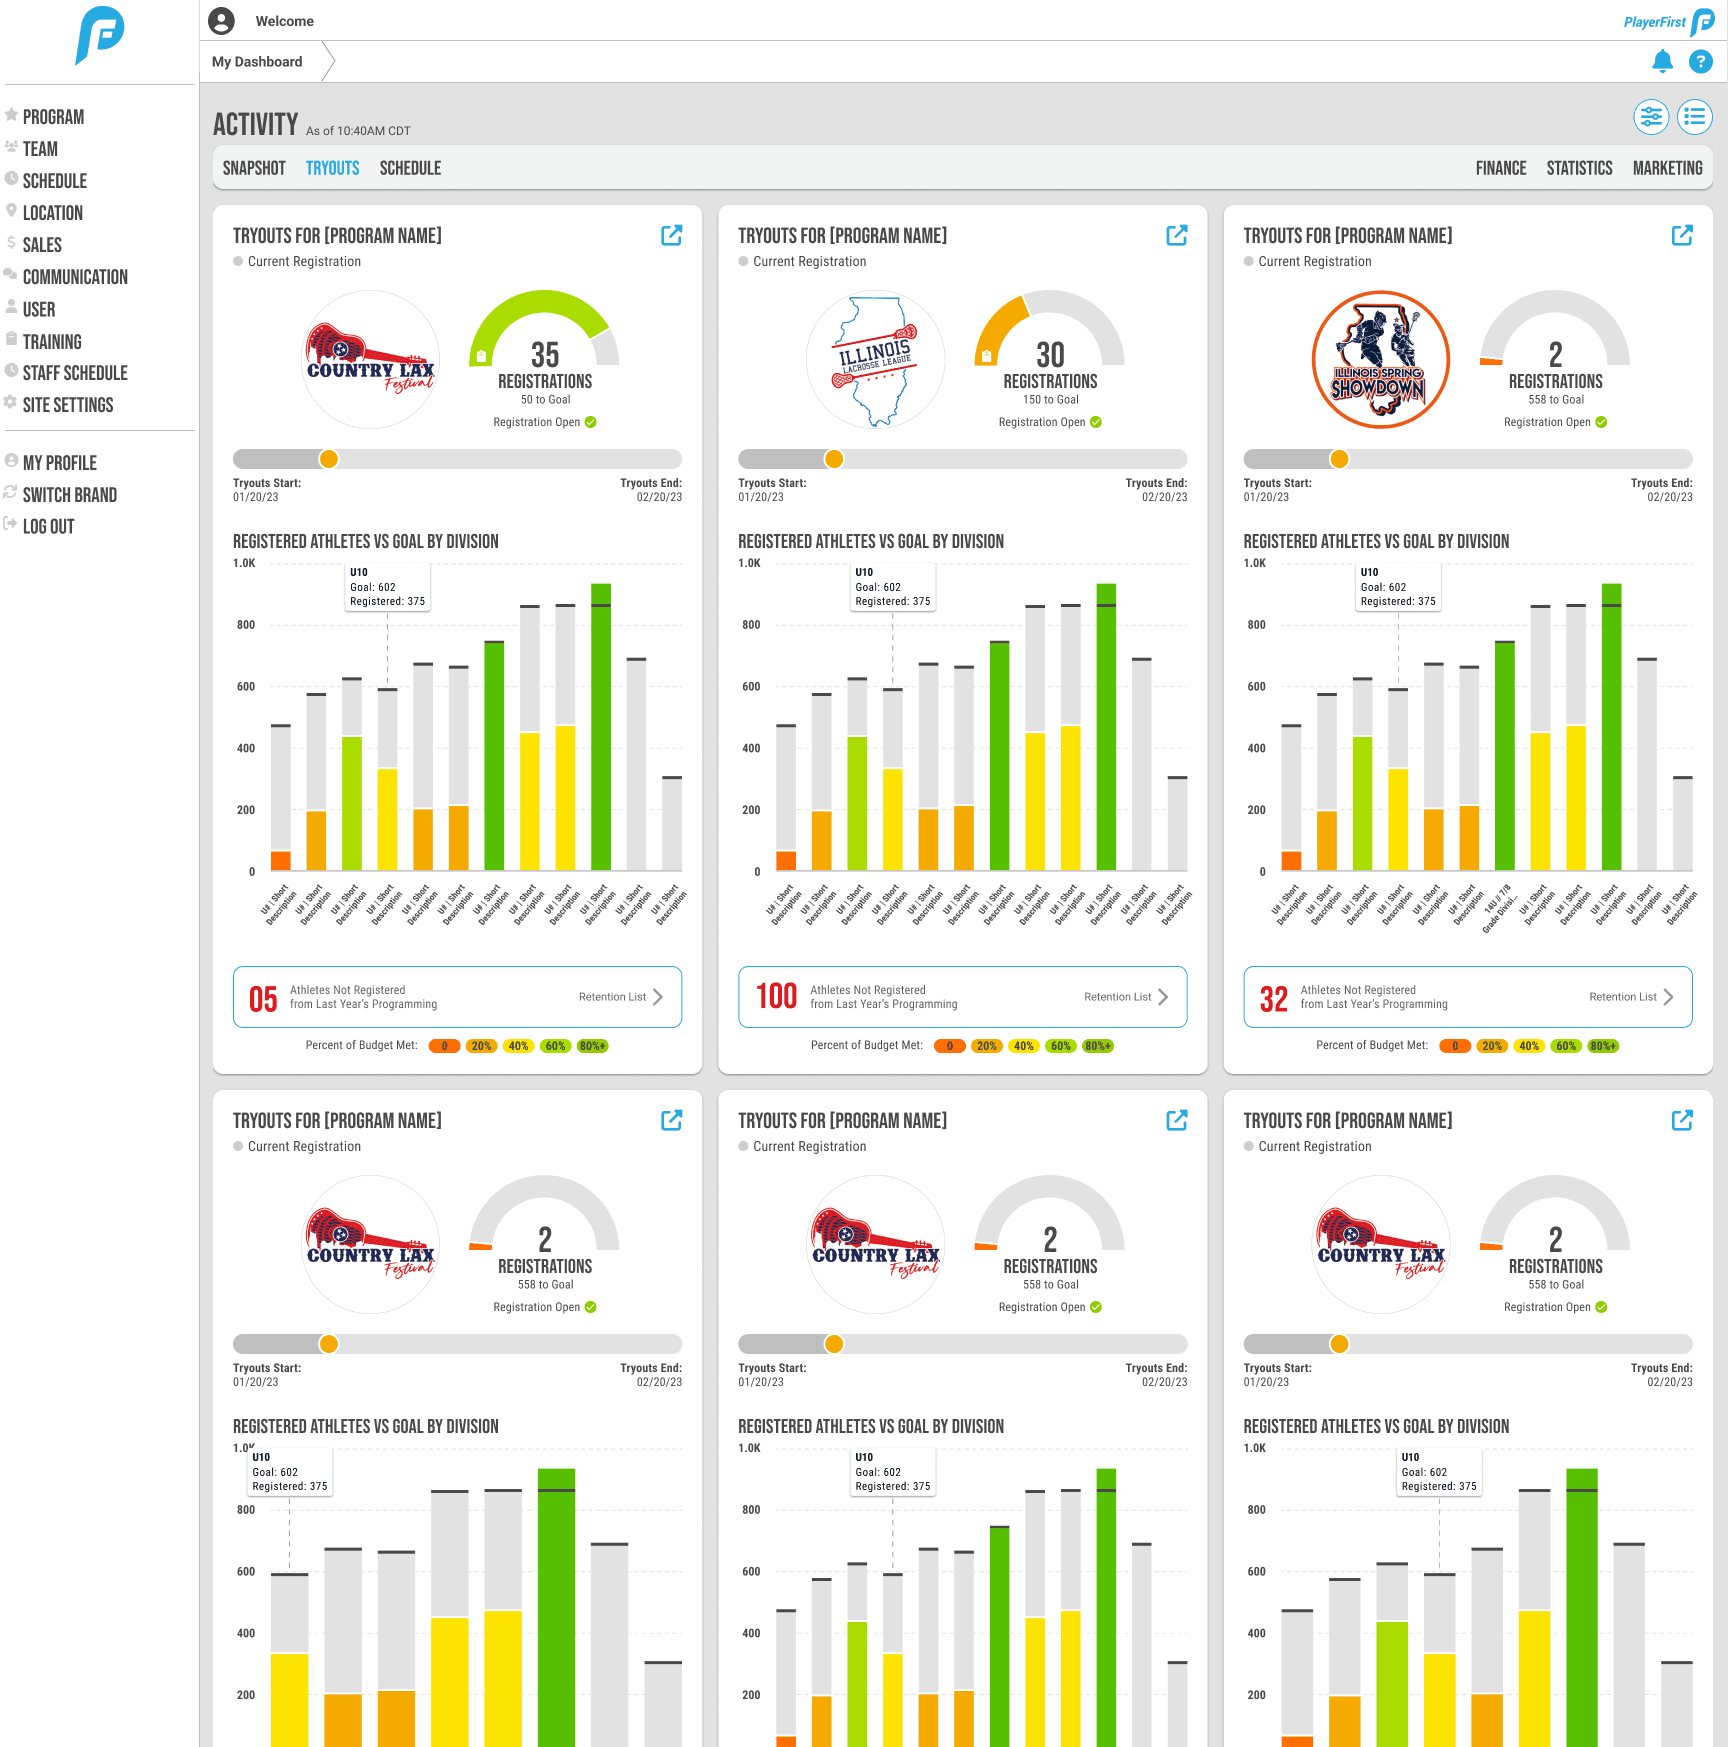
Goal Bar Graph
Performance goals can be visualized across a long period of time or multiple programs/brands.
Toggling Interactions
Toggling Between Program vs Brand Insights
Athletic directors that manage multiple brands can easily toggle between insights for brands or their internal programs.
Time Frame Toggling on Snapshot Tab
The snapshot tab allows admin to determine if they want to see the most recent updates from the past 24 hours or the current day.
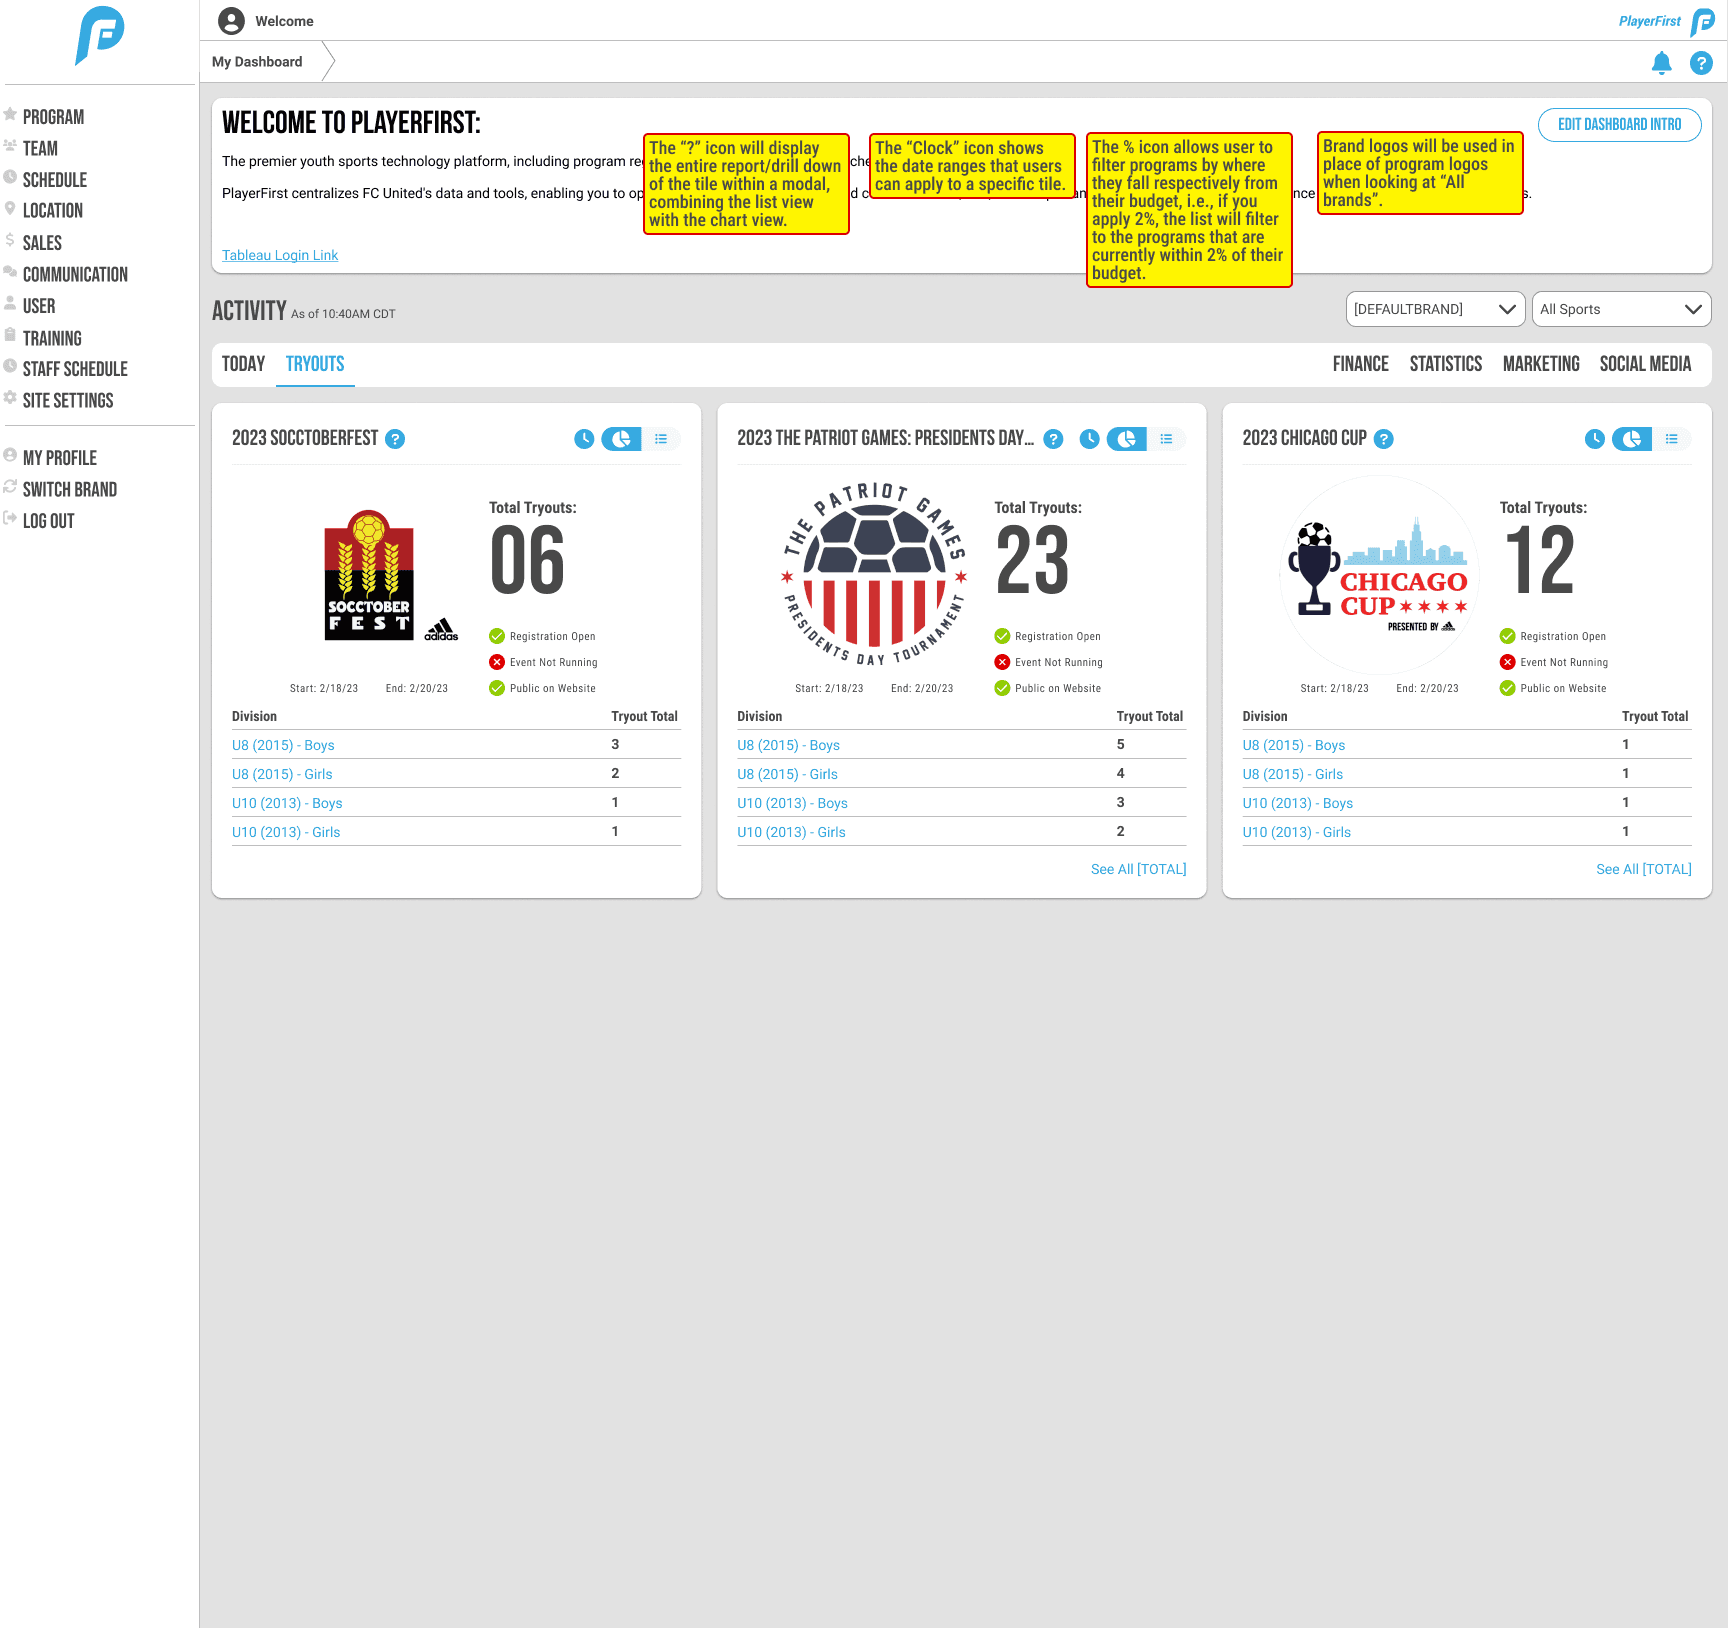
Generating a Retention List to Compare Previous Tryout Registrations
For the Tryouts tab, we introduced an action to help boost athlete registrations by comparing the athletes registered for the current and previous year's tryouts.
The info button included on each tryout tile links to an auto-generated retention list, on a separate page, with filters that can be modified from there.
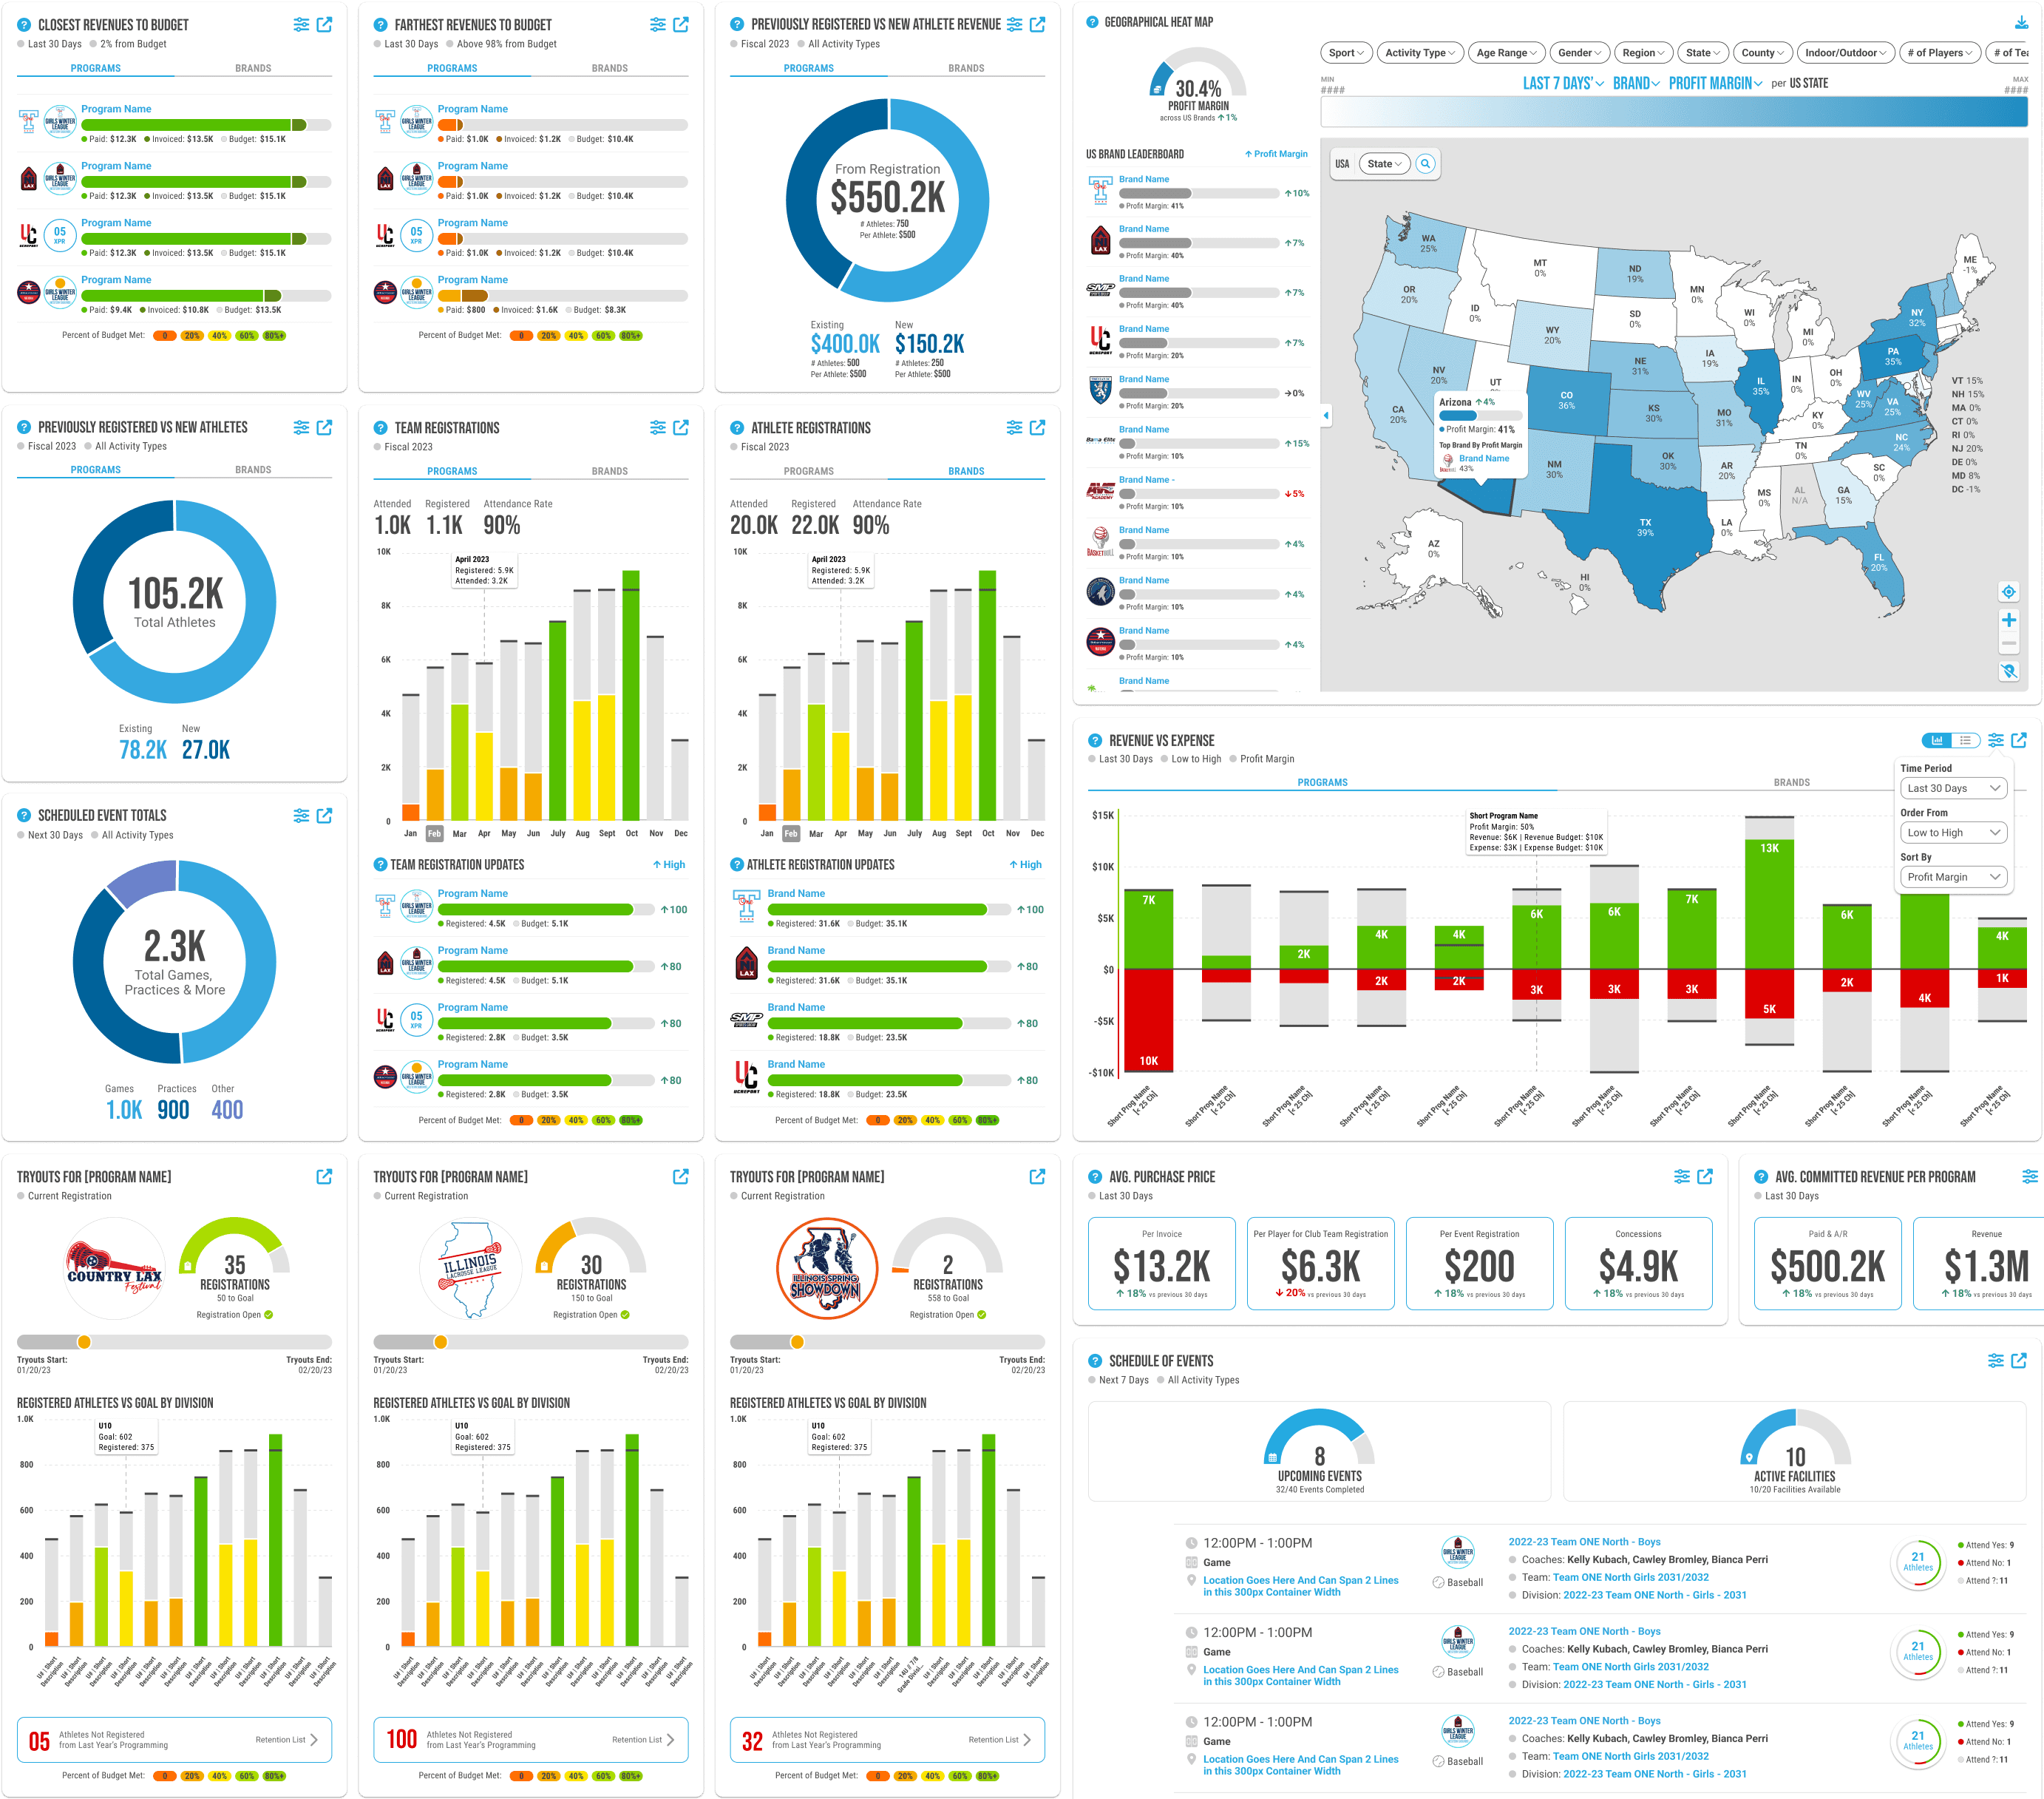
Final Designs
Dashboard Analysis Tabs
Explore the second iteration of dashboard tabs created from 2 months of agile design. Intermittent feedback from brands informed the final tiles that appear.
1
Snapshot Tab
The most recent updates presented conveniently on the first dashboard tab
2
Tryout Tab
Predictions and Overall Insights
3
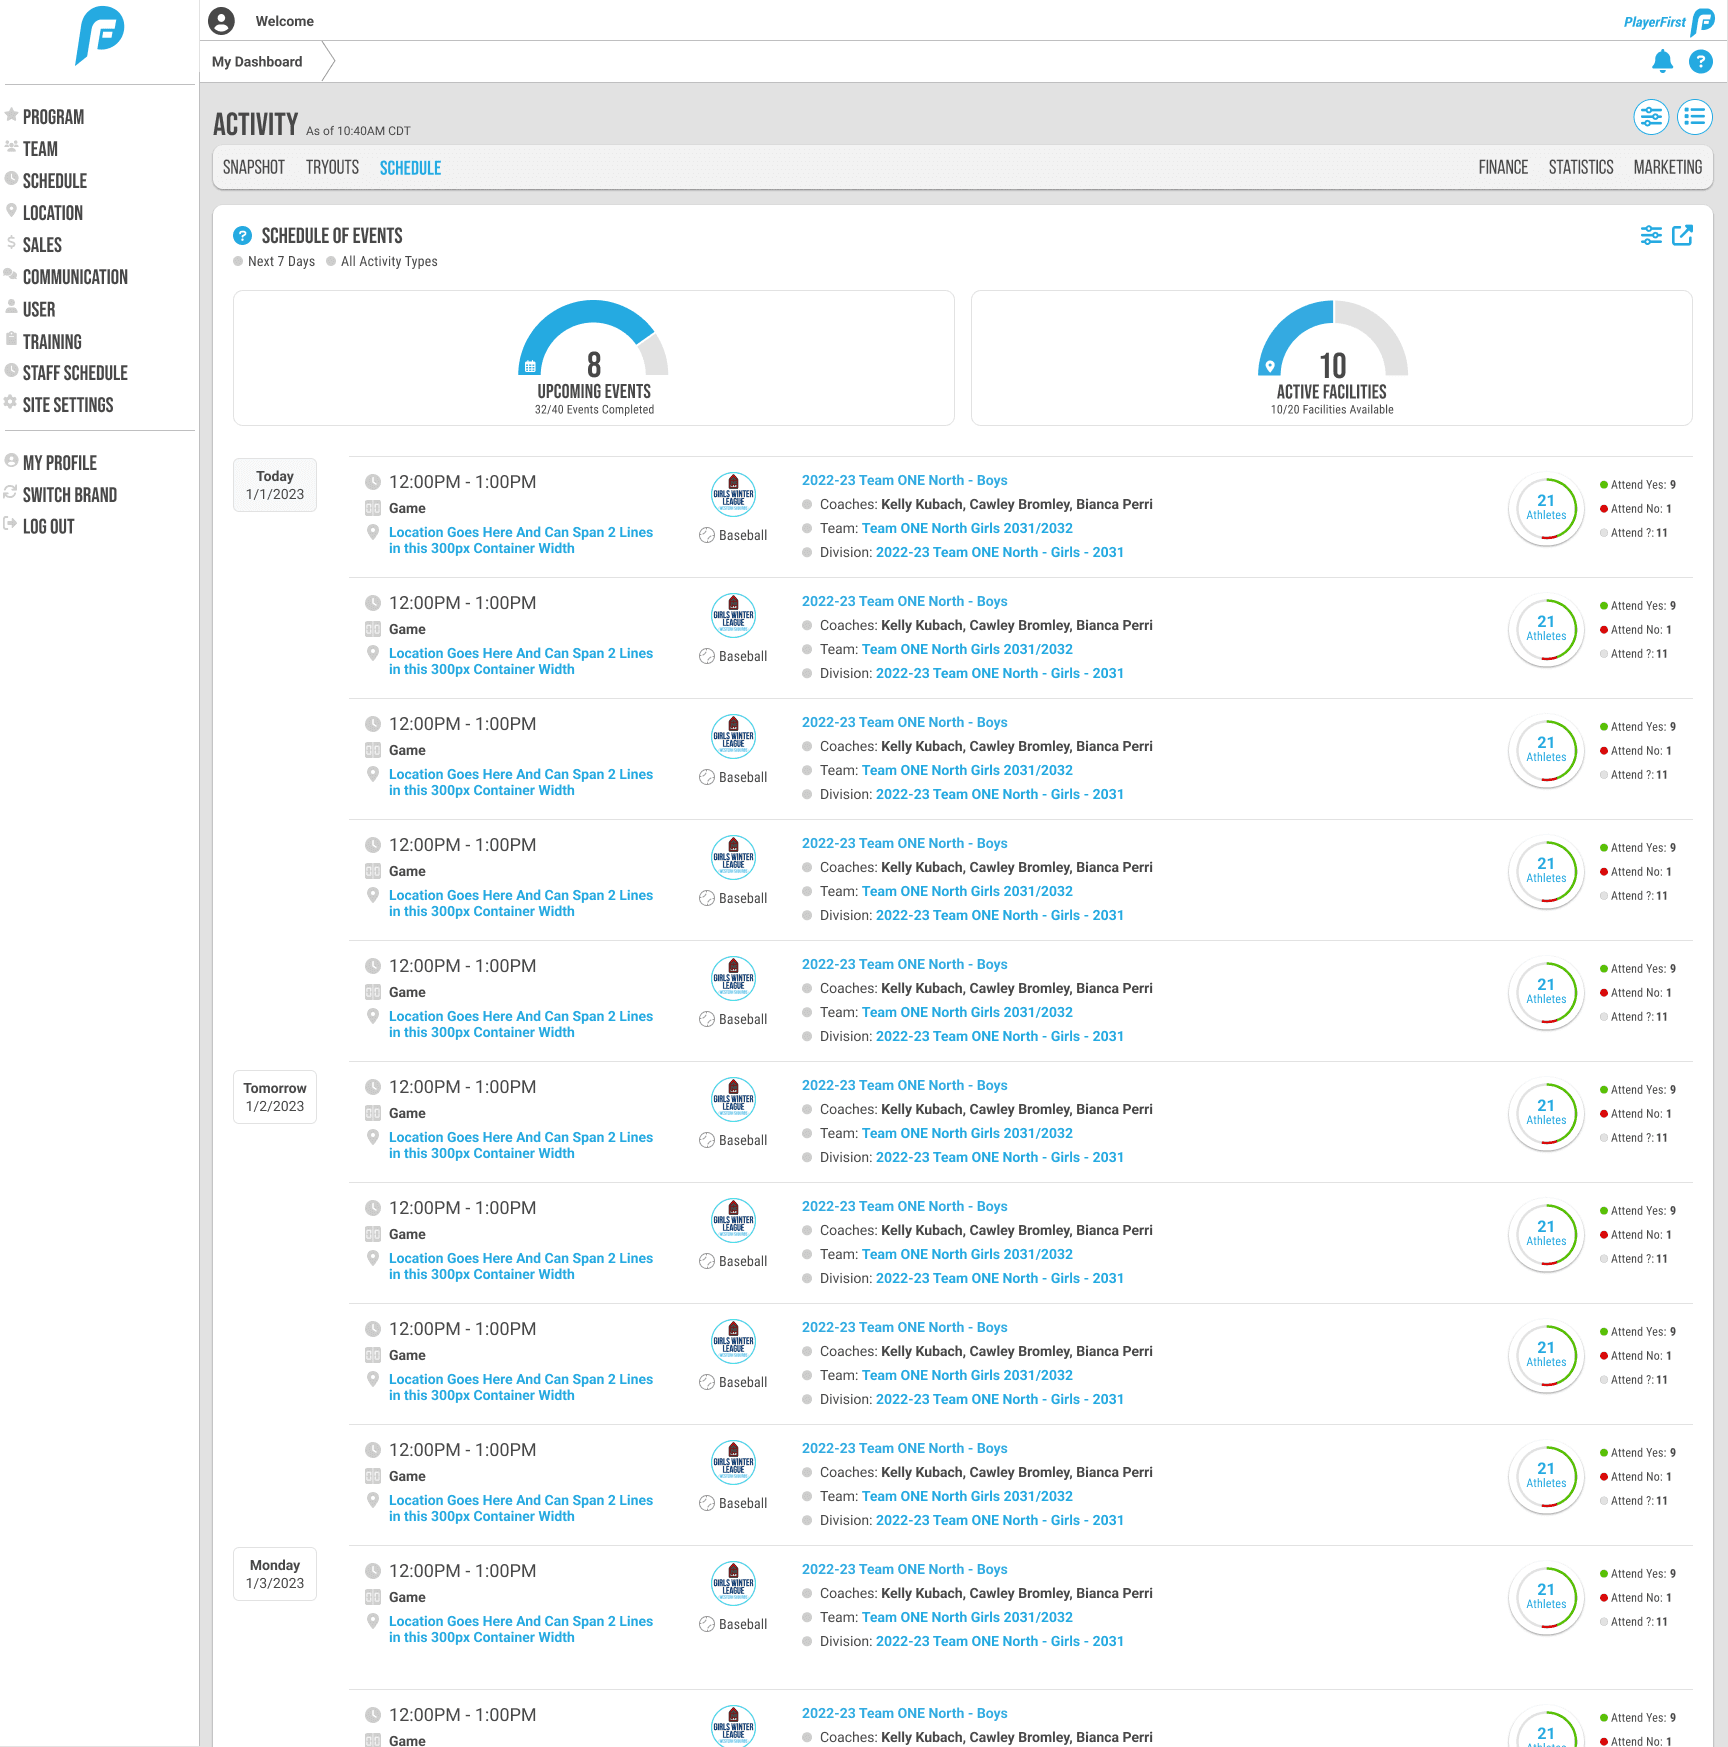
Schedule Tab
Presents the key details of the product before providing buttons to start the purchase.
4
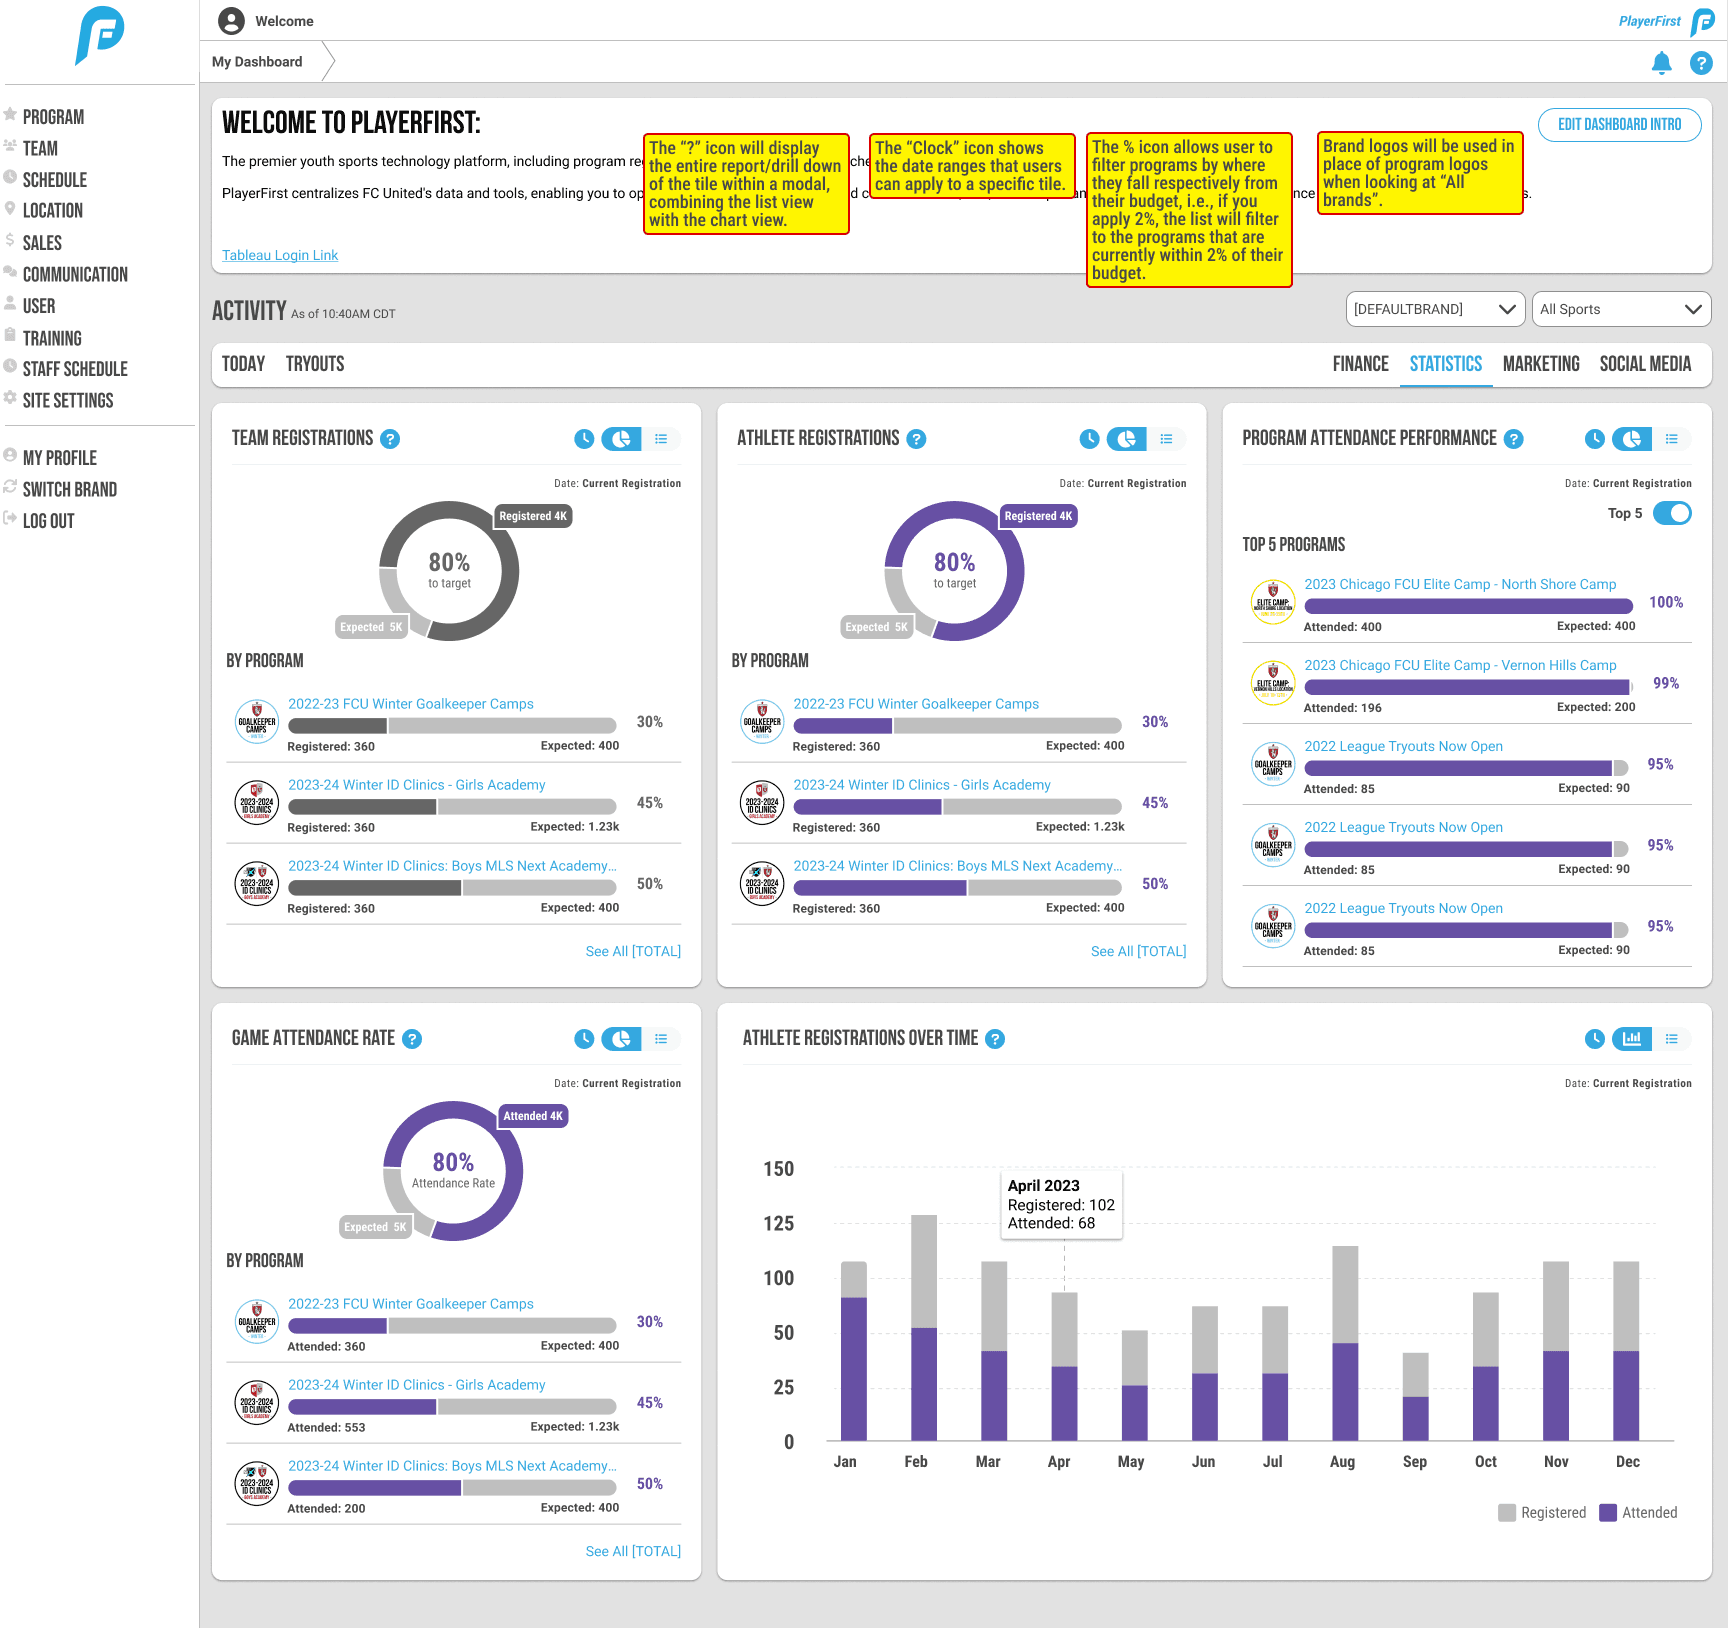
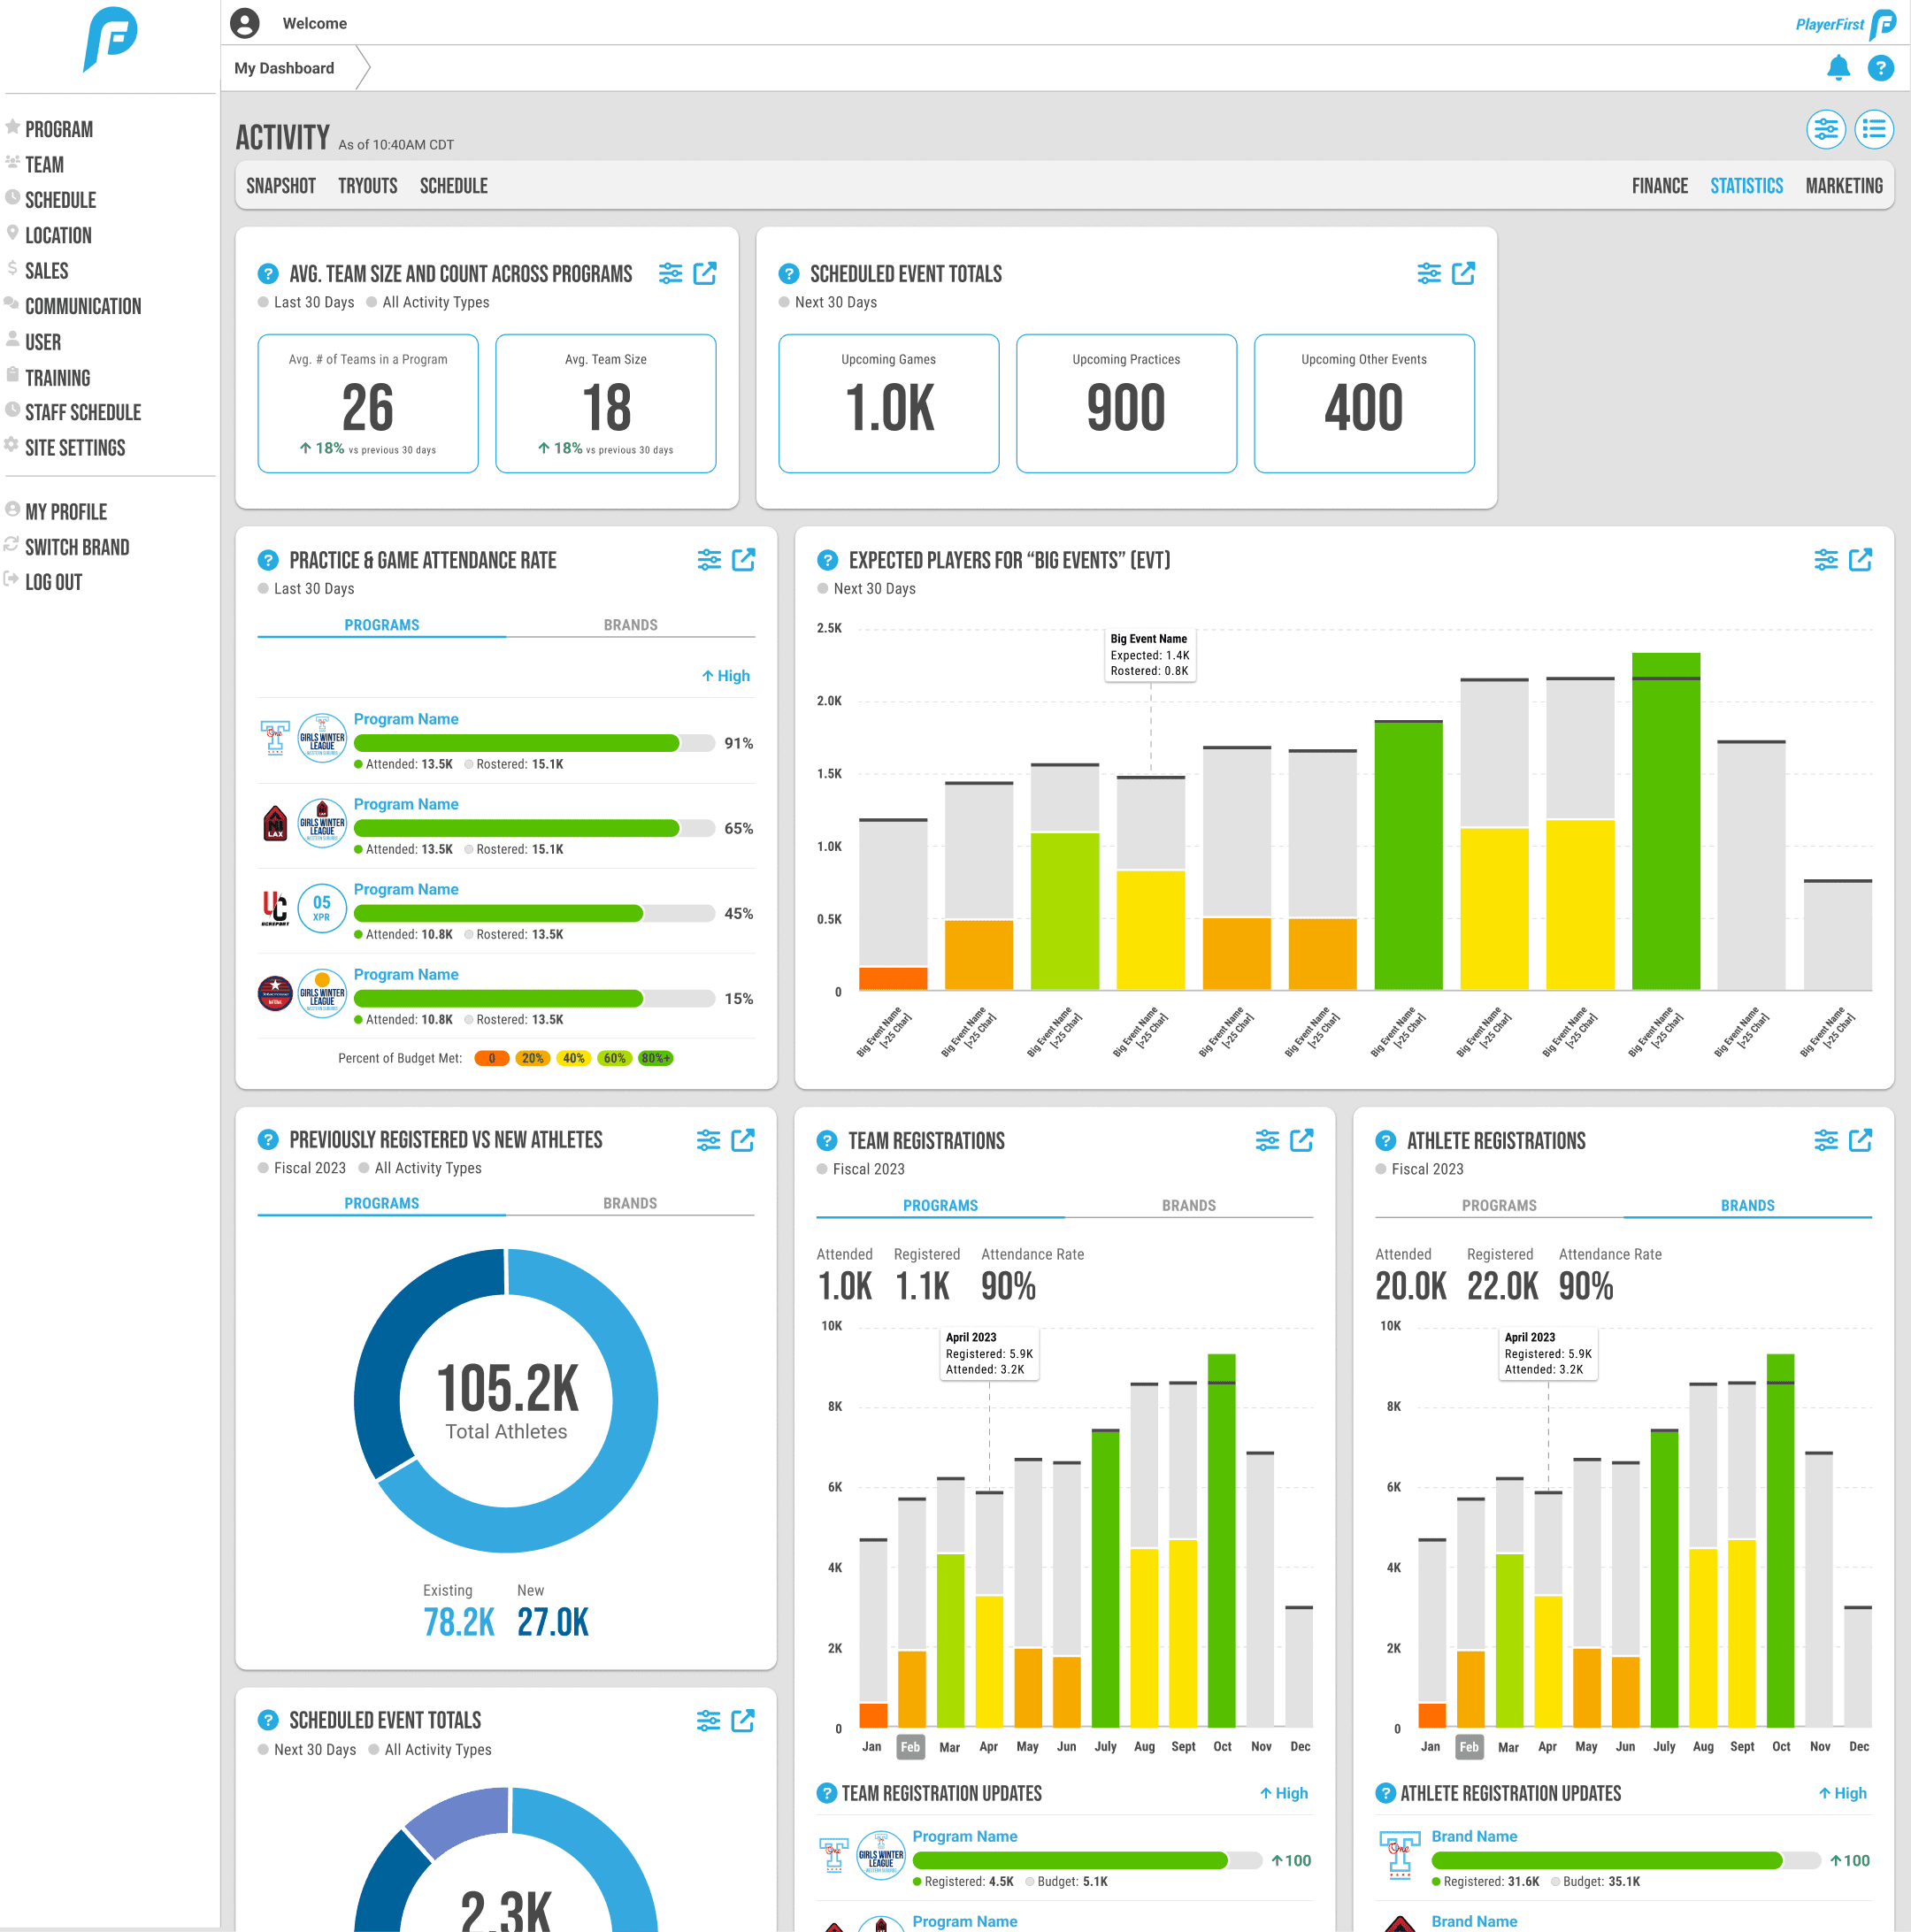
Statistics Tab
Registration statistics for athlete retention and growth
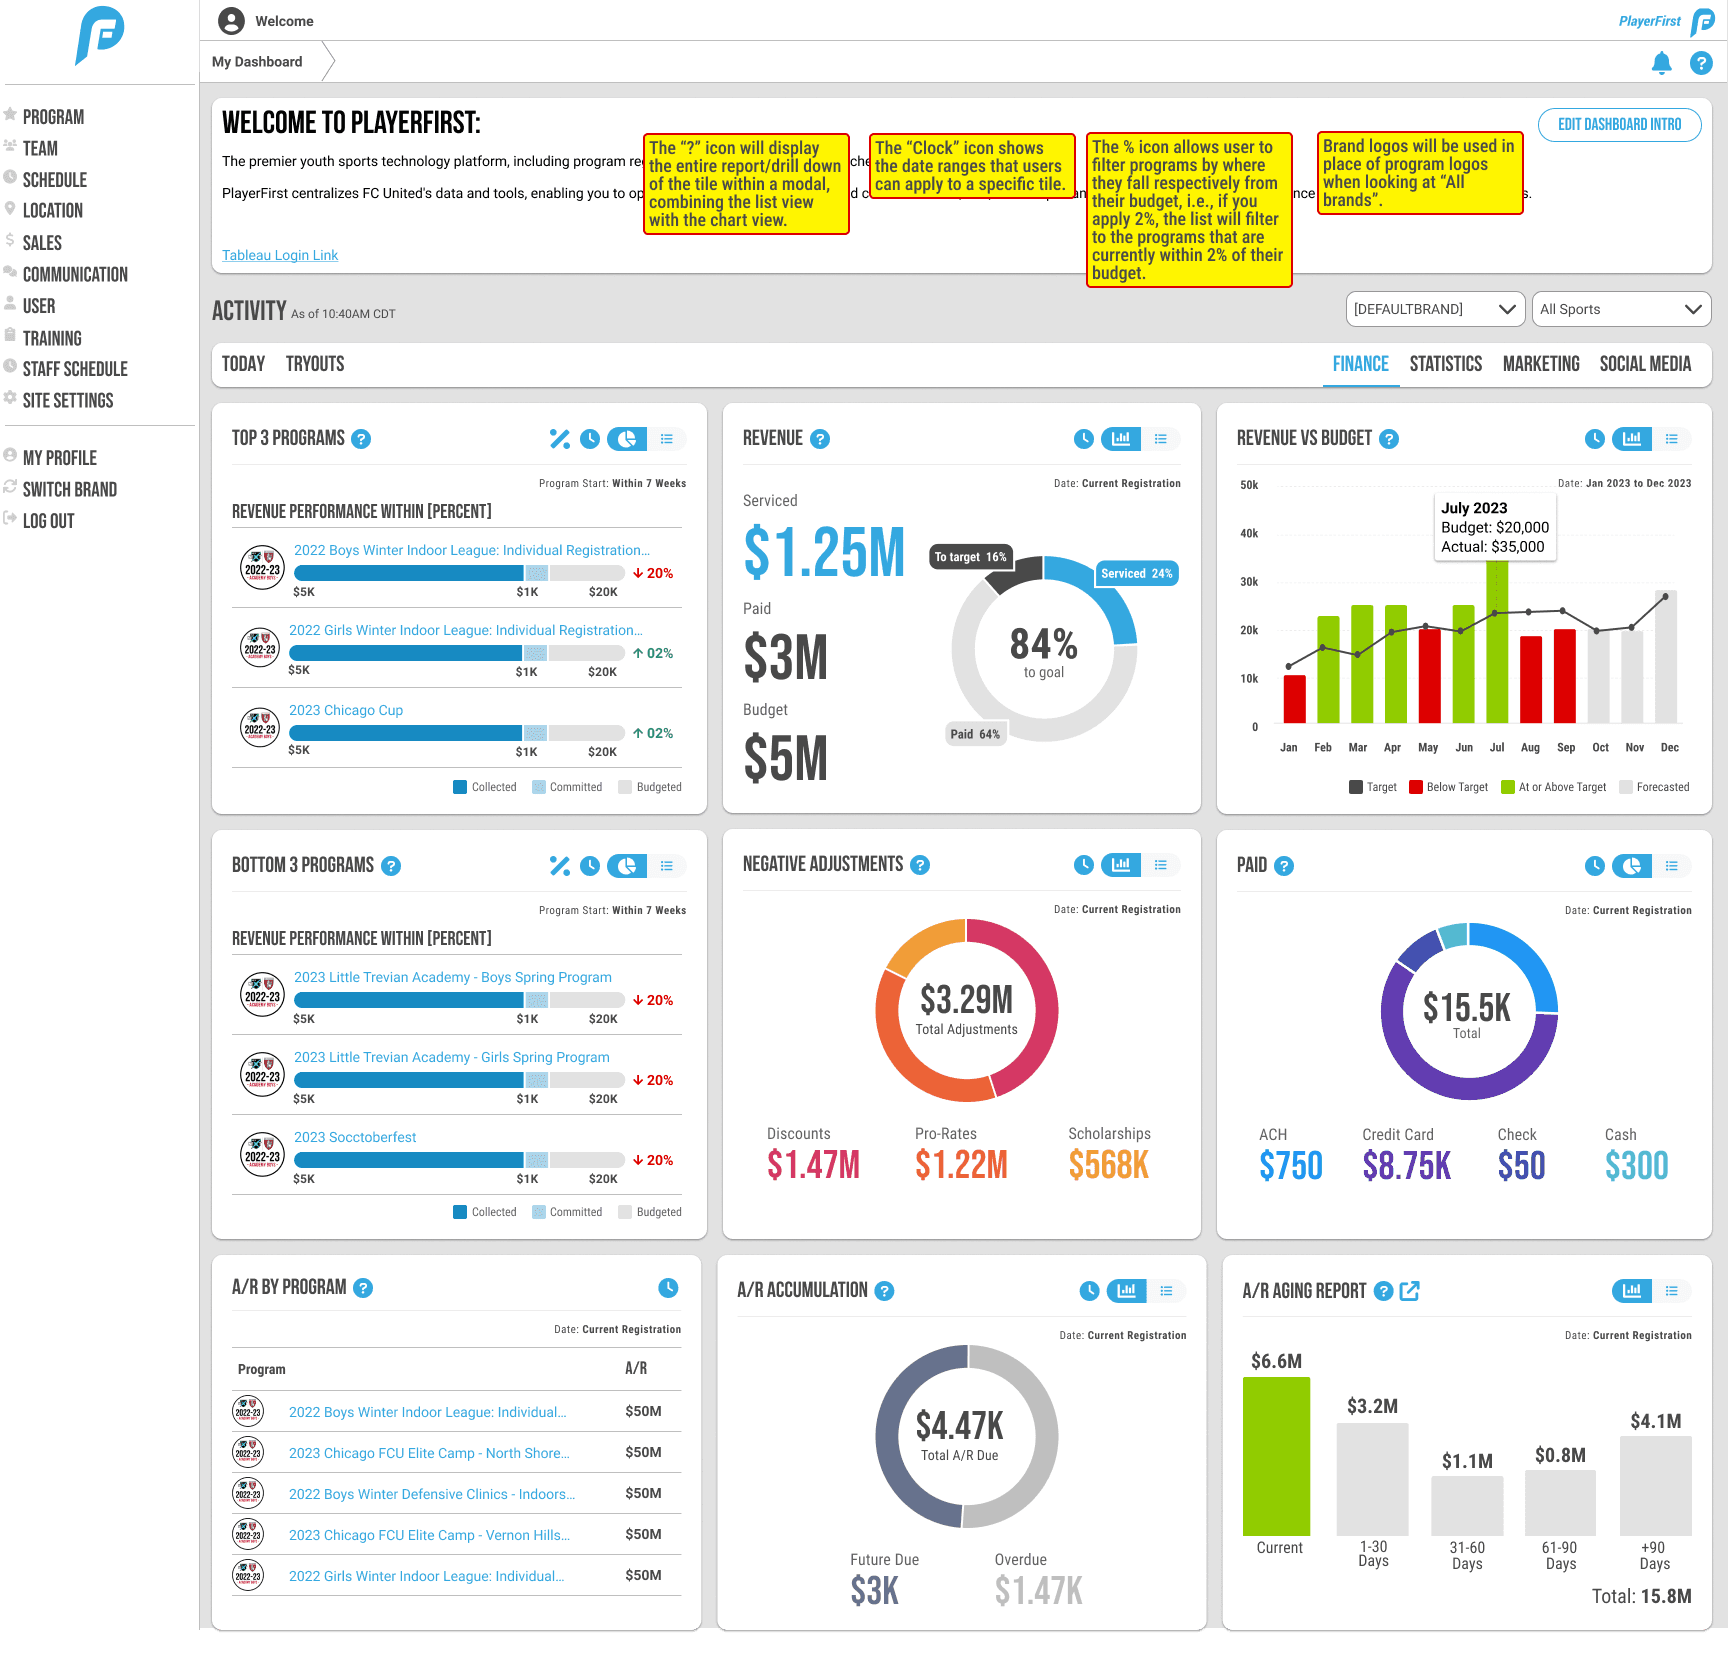
5
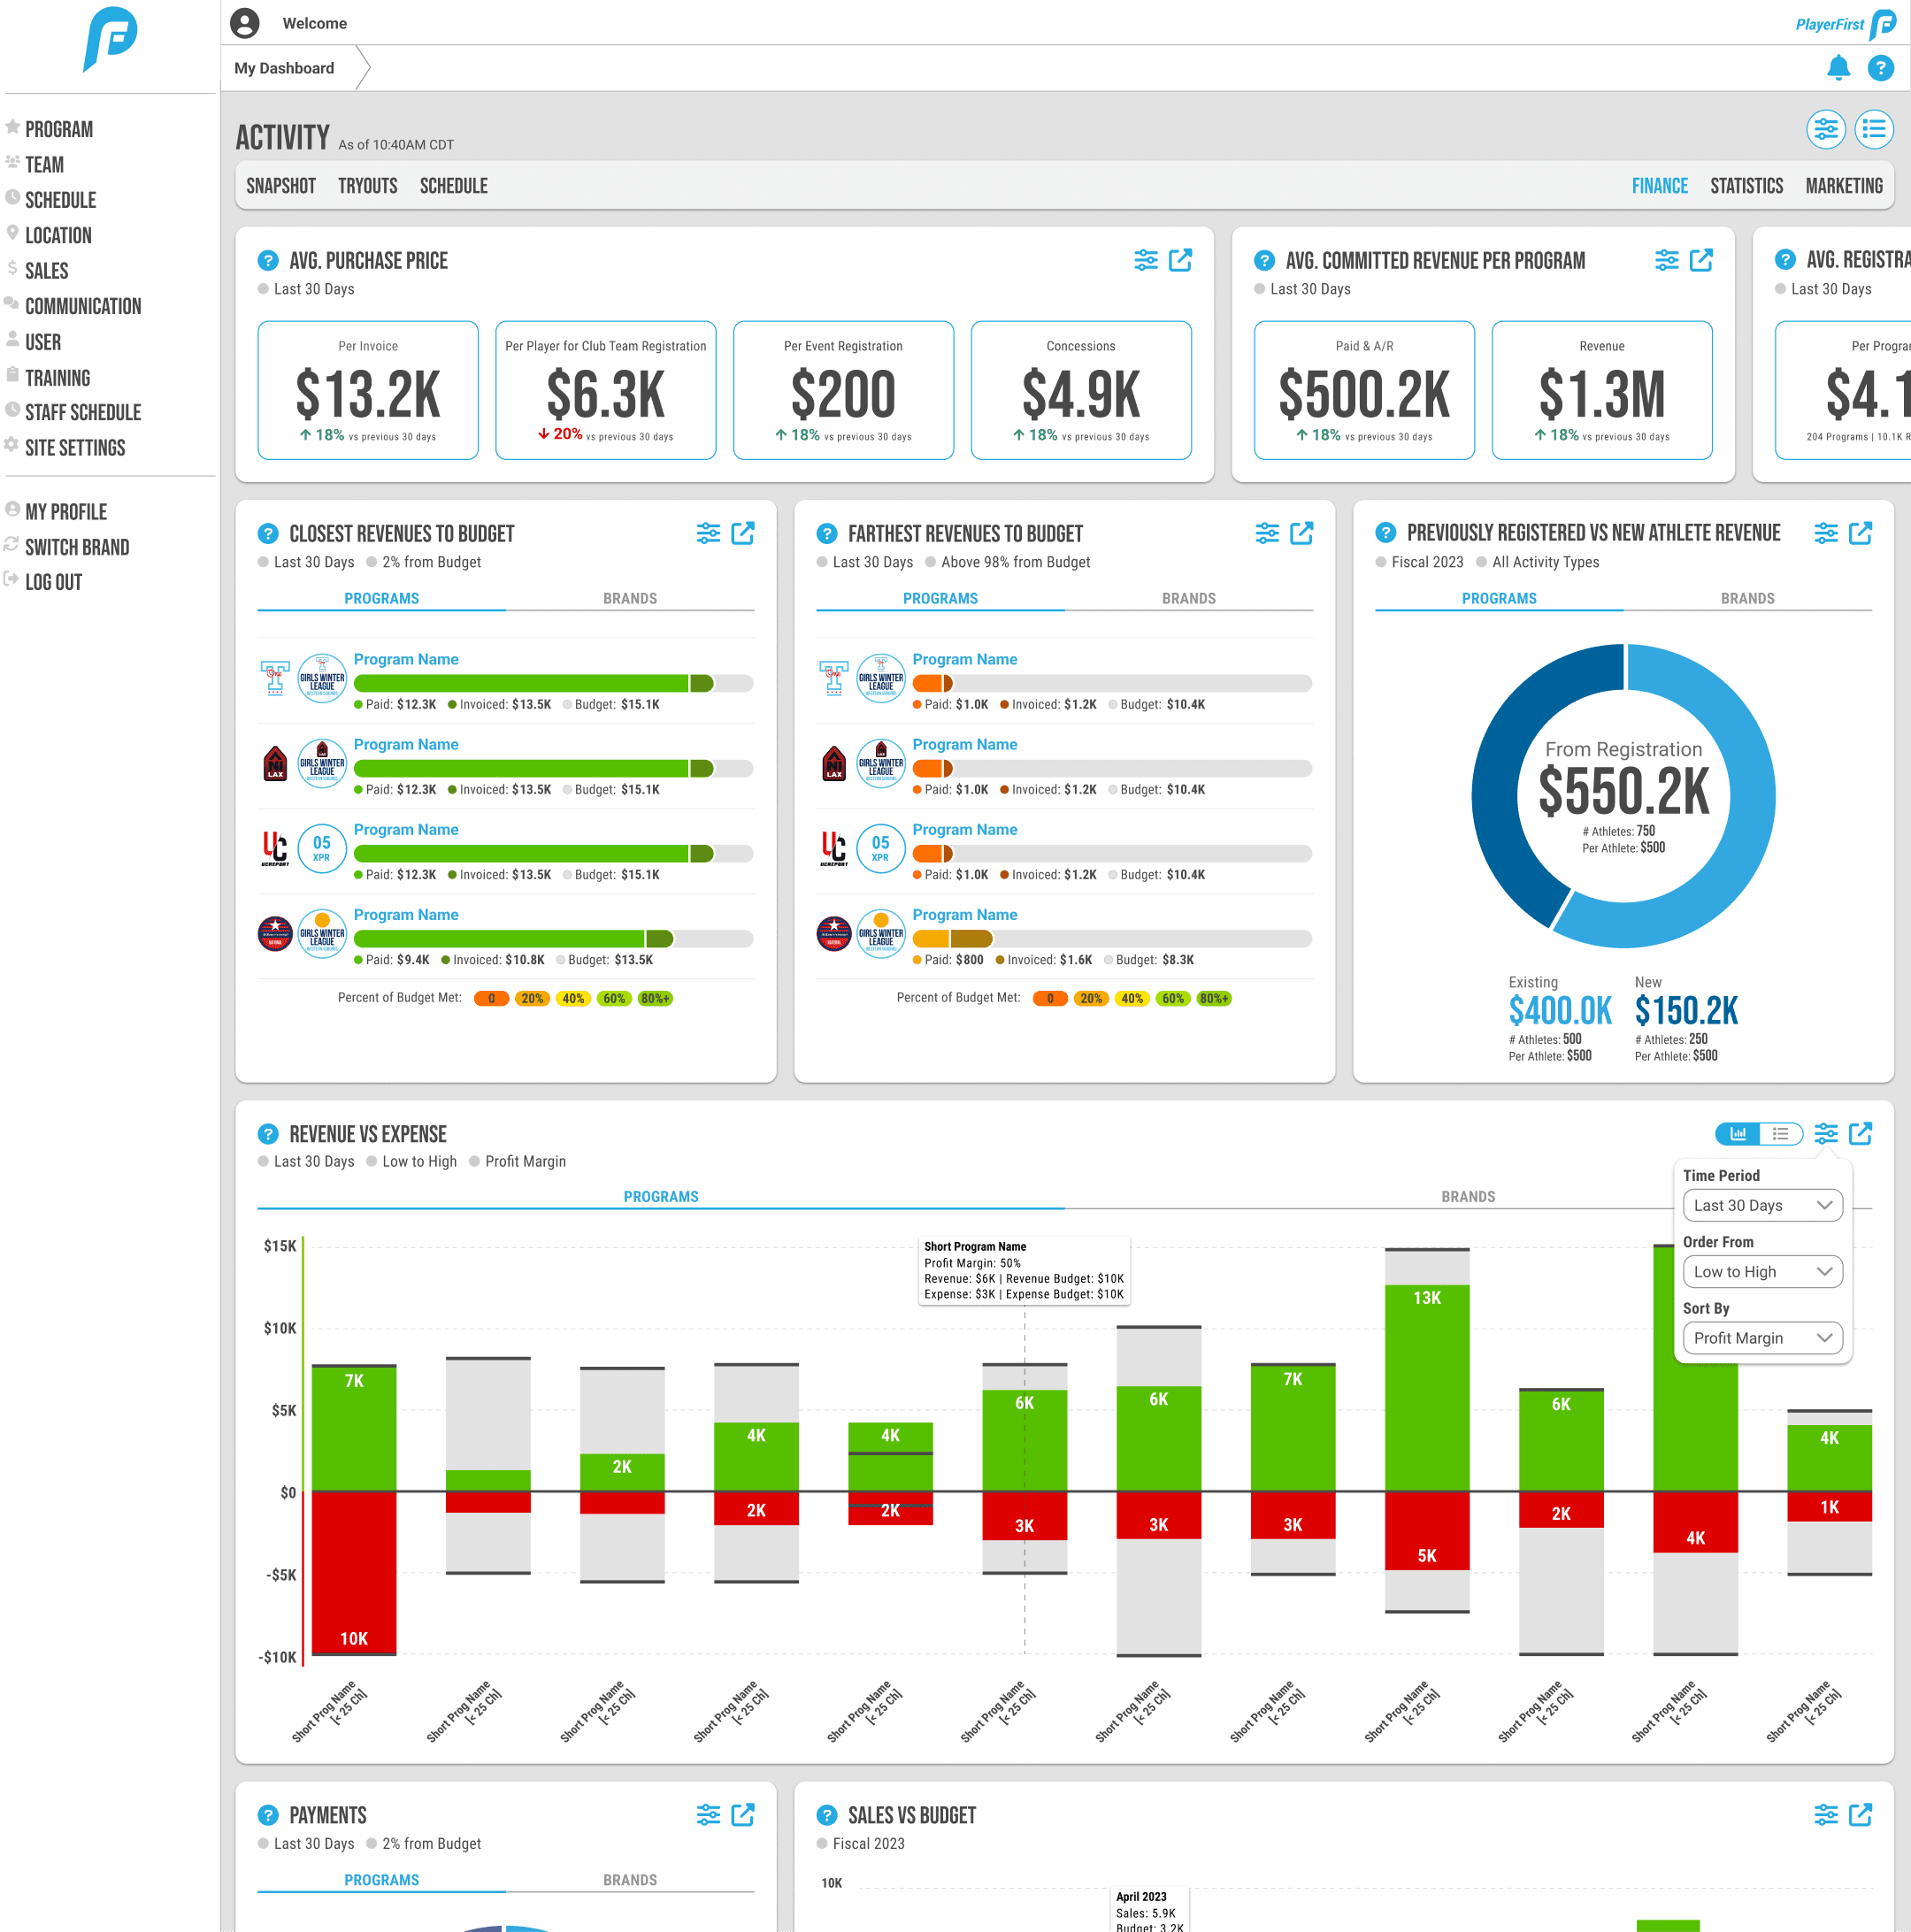
Financial Tab
Insights about long-term program and brand financial strength
6
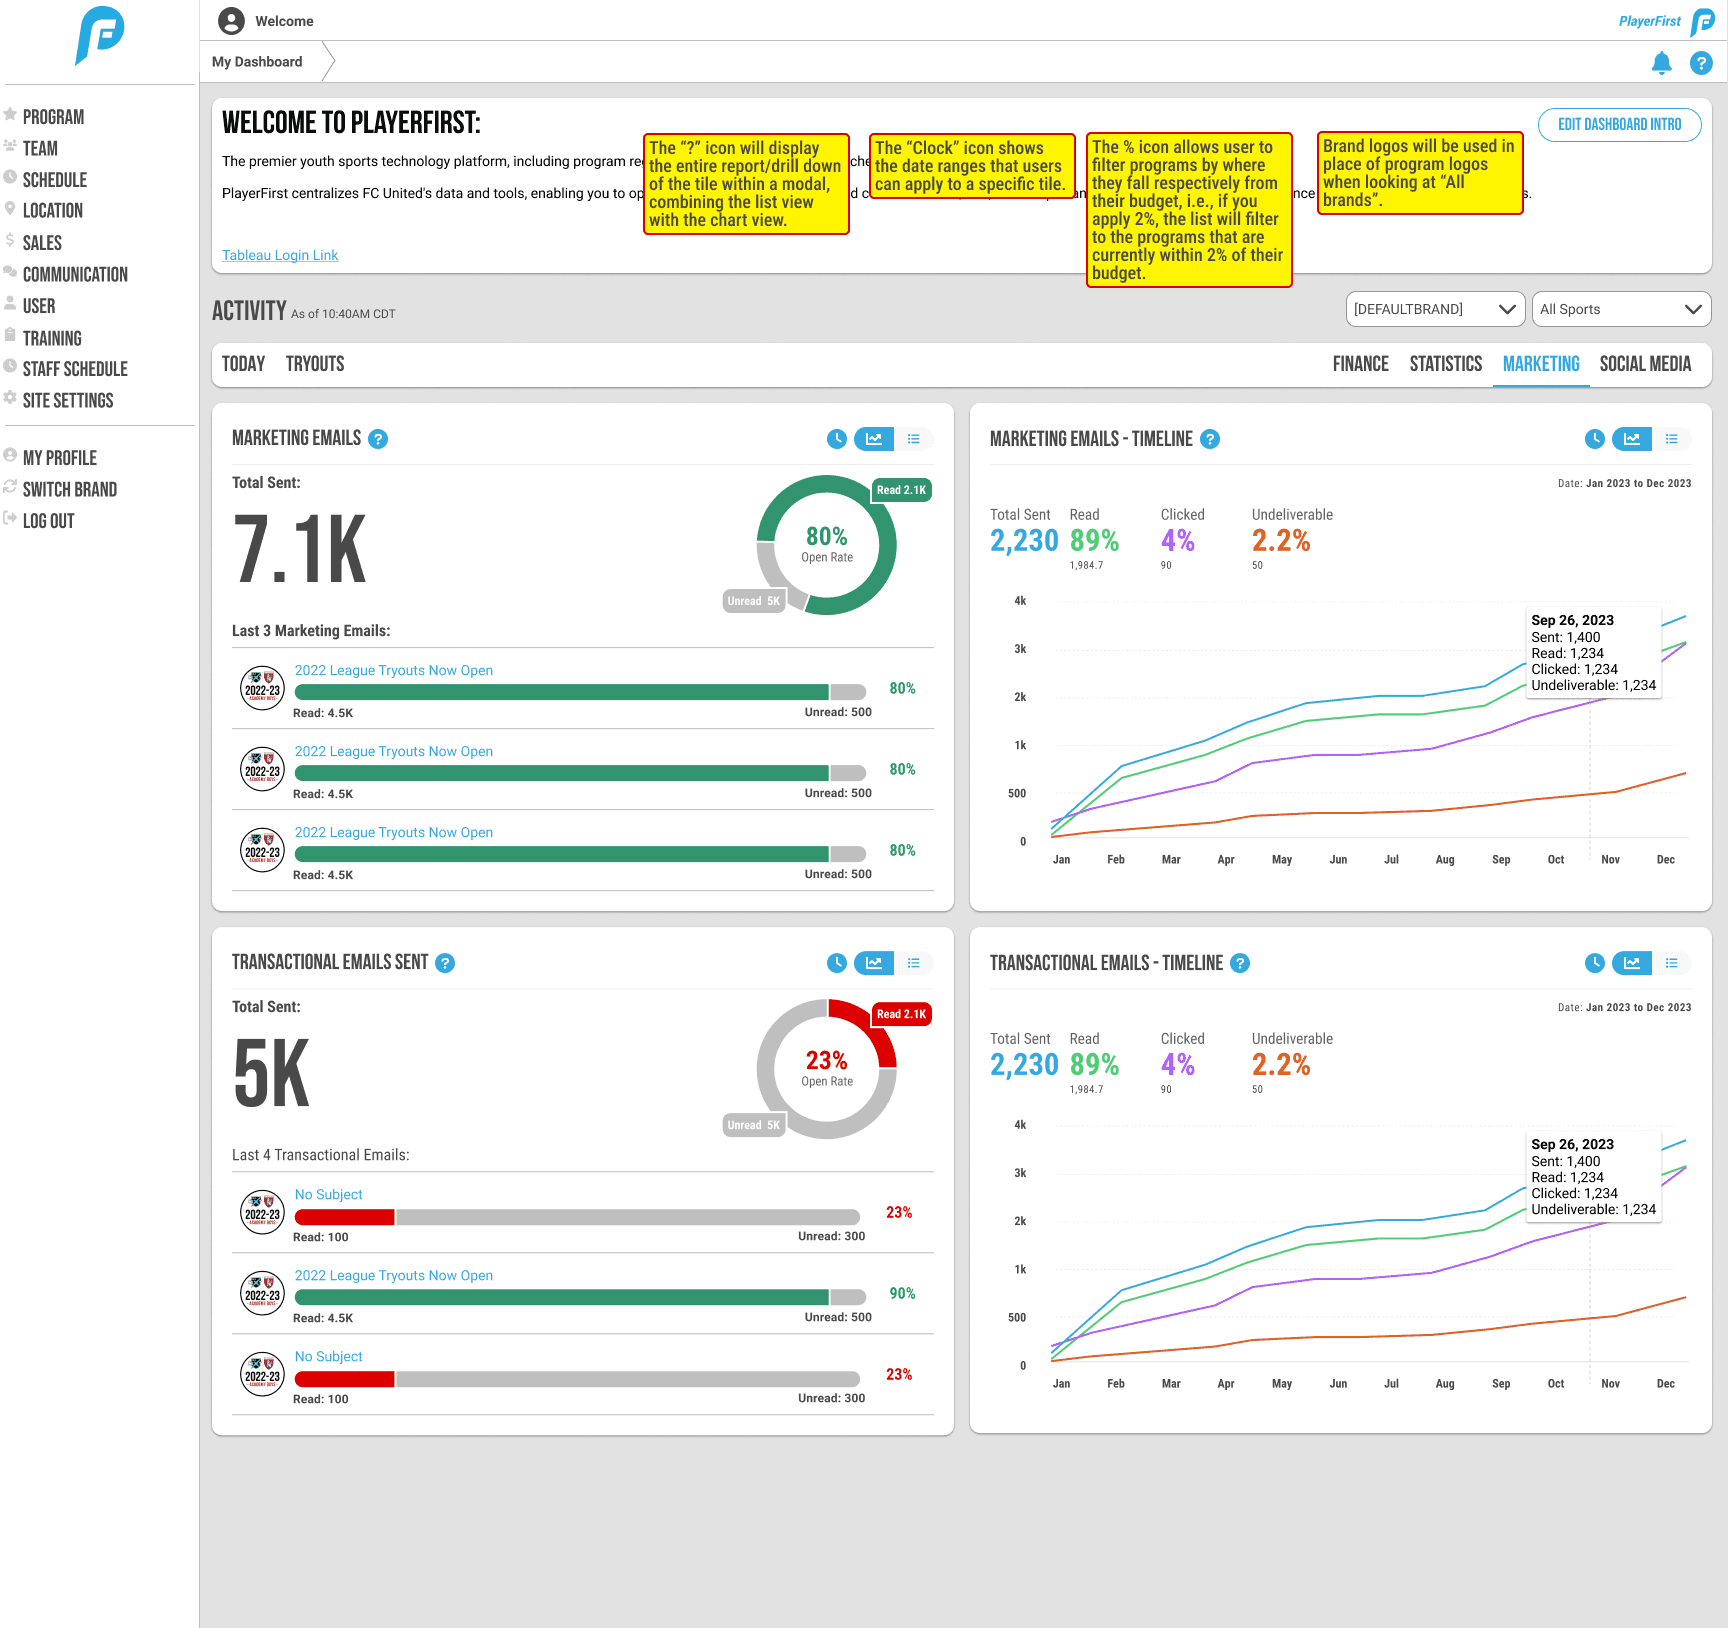
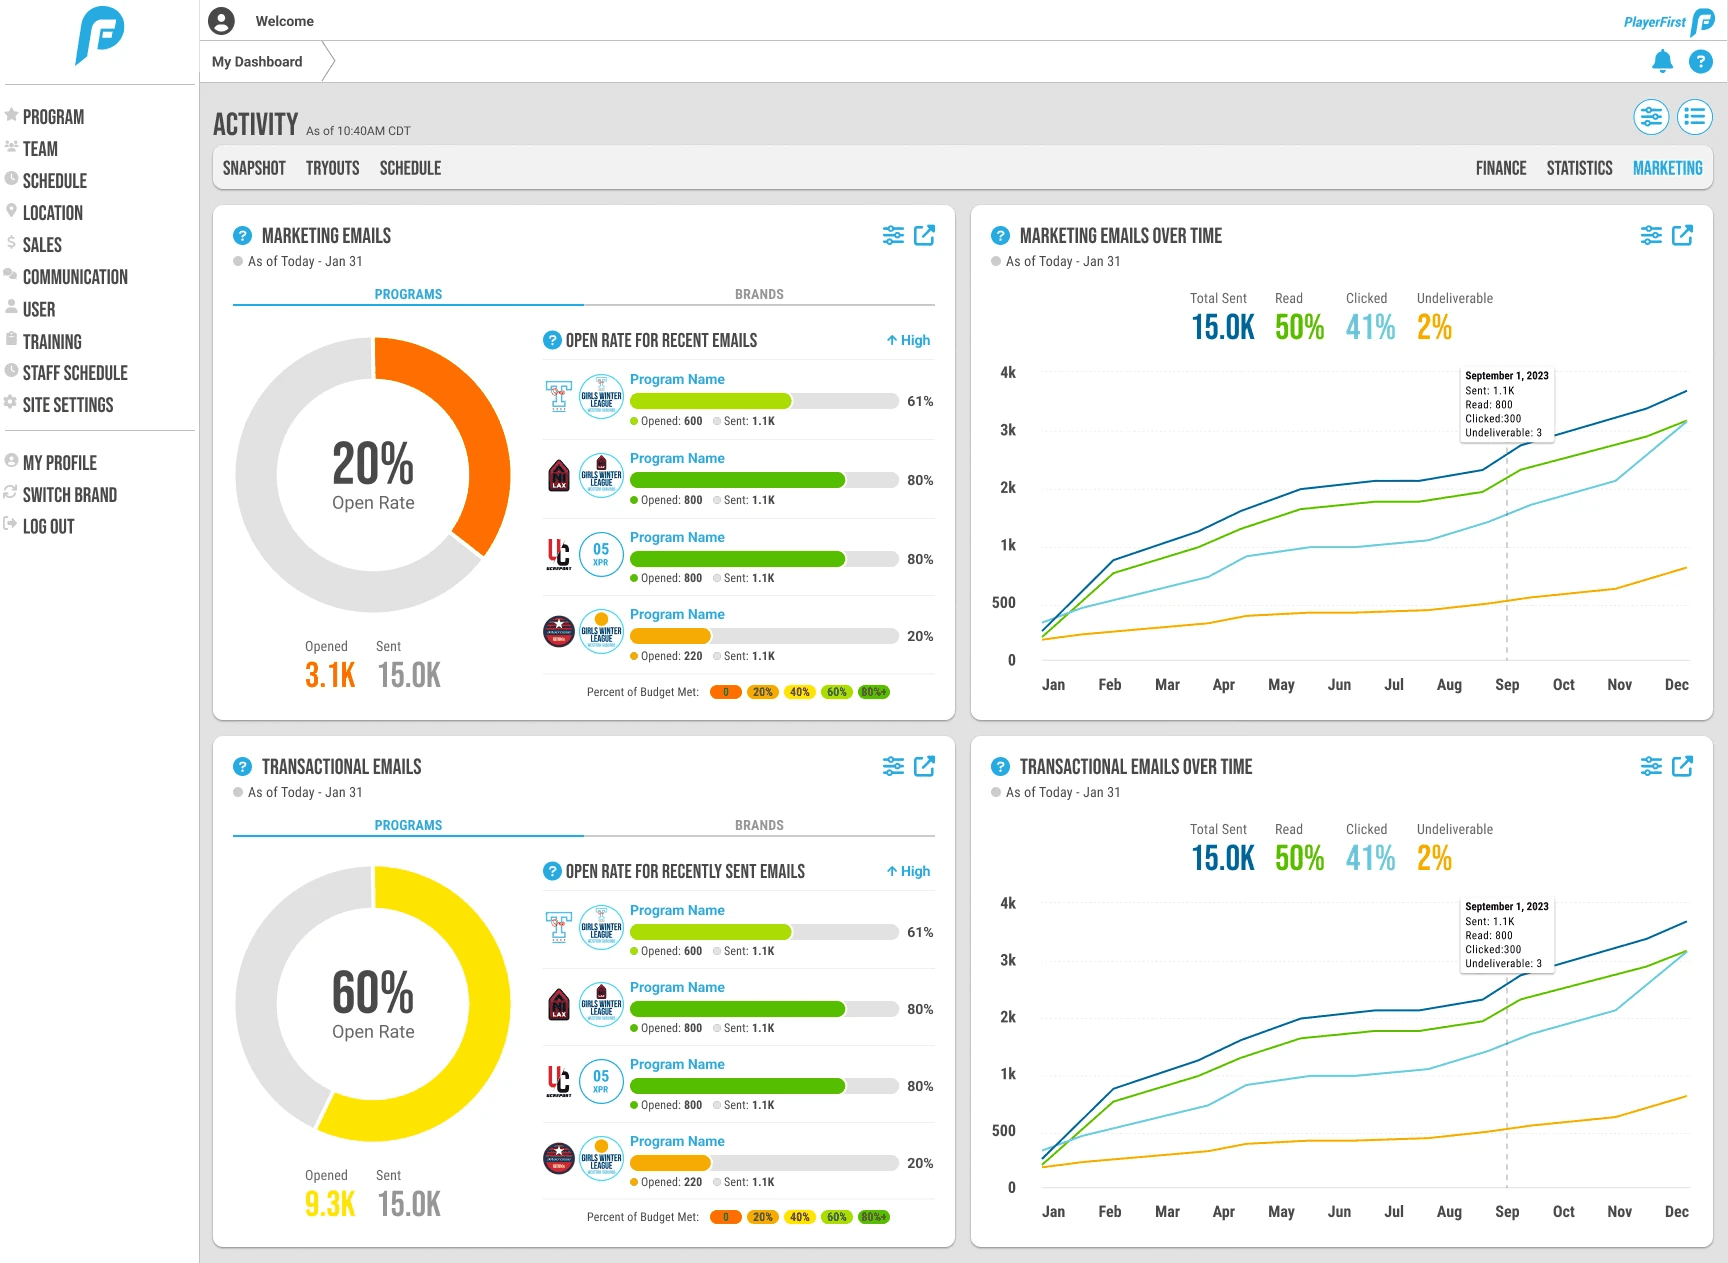
Marketing Tab
Email marketing statistics to assess performance
Providing a TV Dashboard Display for Admin Offices
To help admin to stay up to date with the latest insights about their athletic brands, we created an TV dashboard display.
To create this feature, I standardized the logic for how tiles are shown on a page's grid as tiles are toggle between shown and hidden. I worked heavily with project manager TJ to gather requirements for this experience.
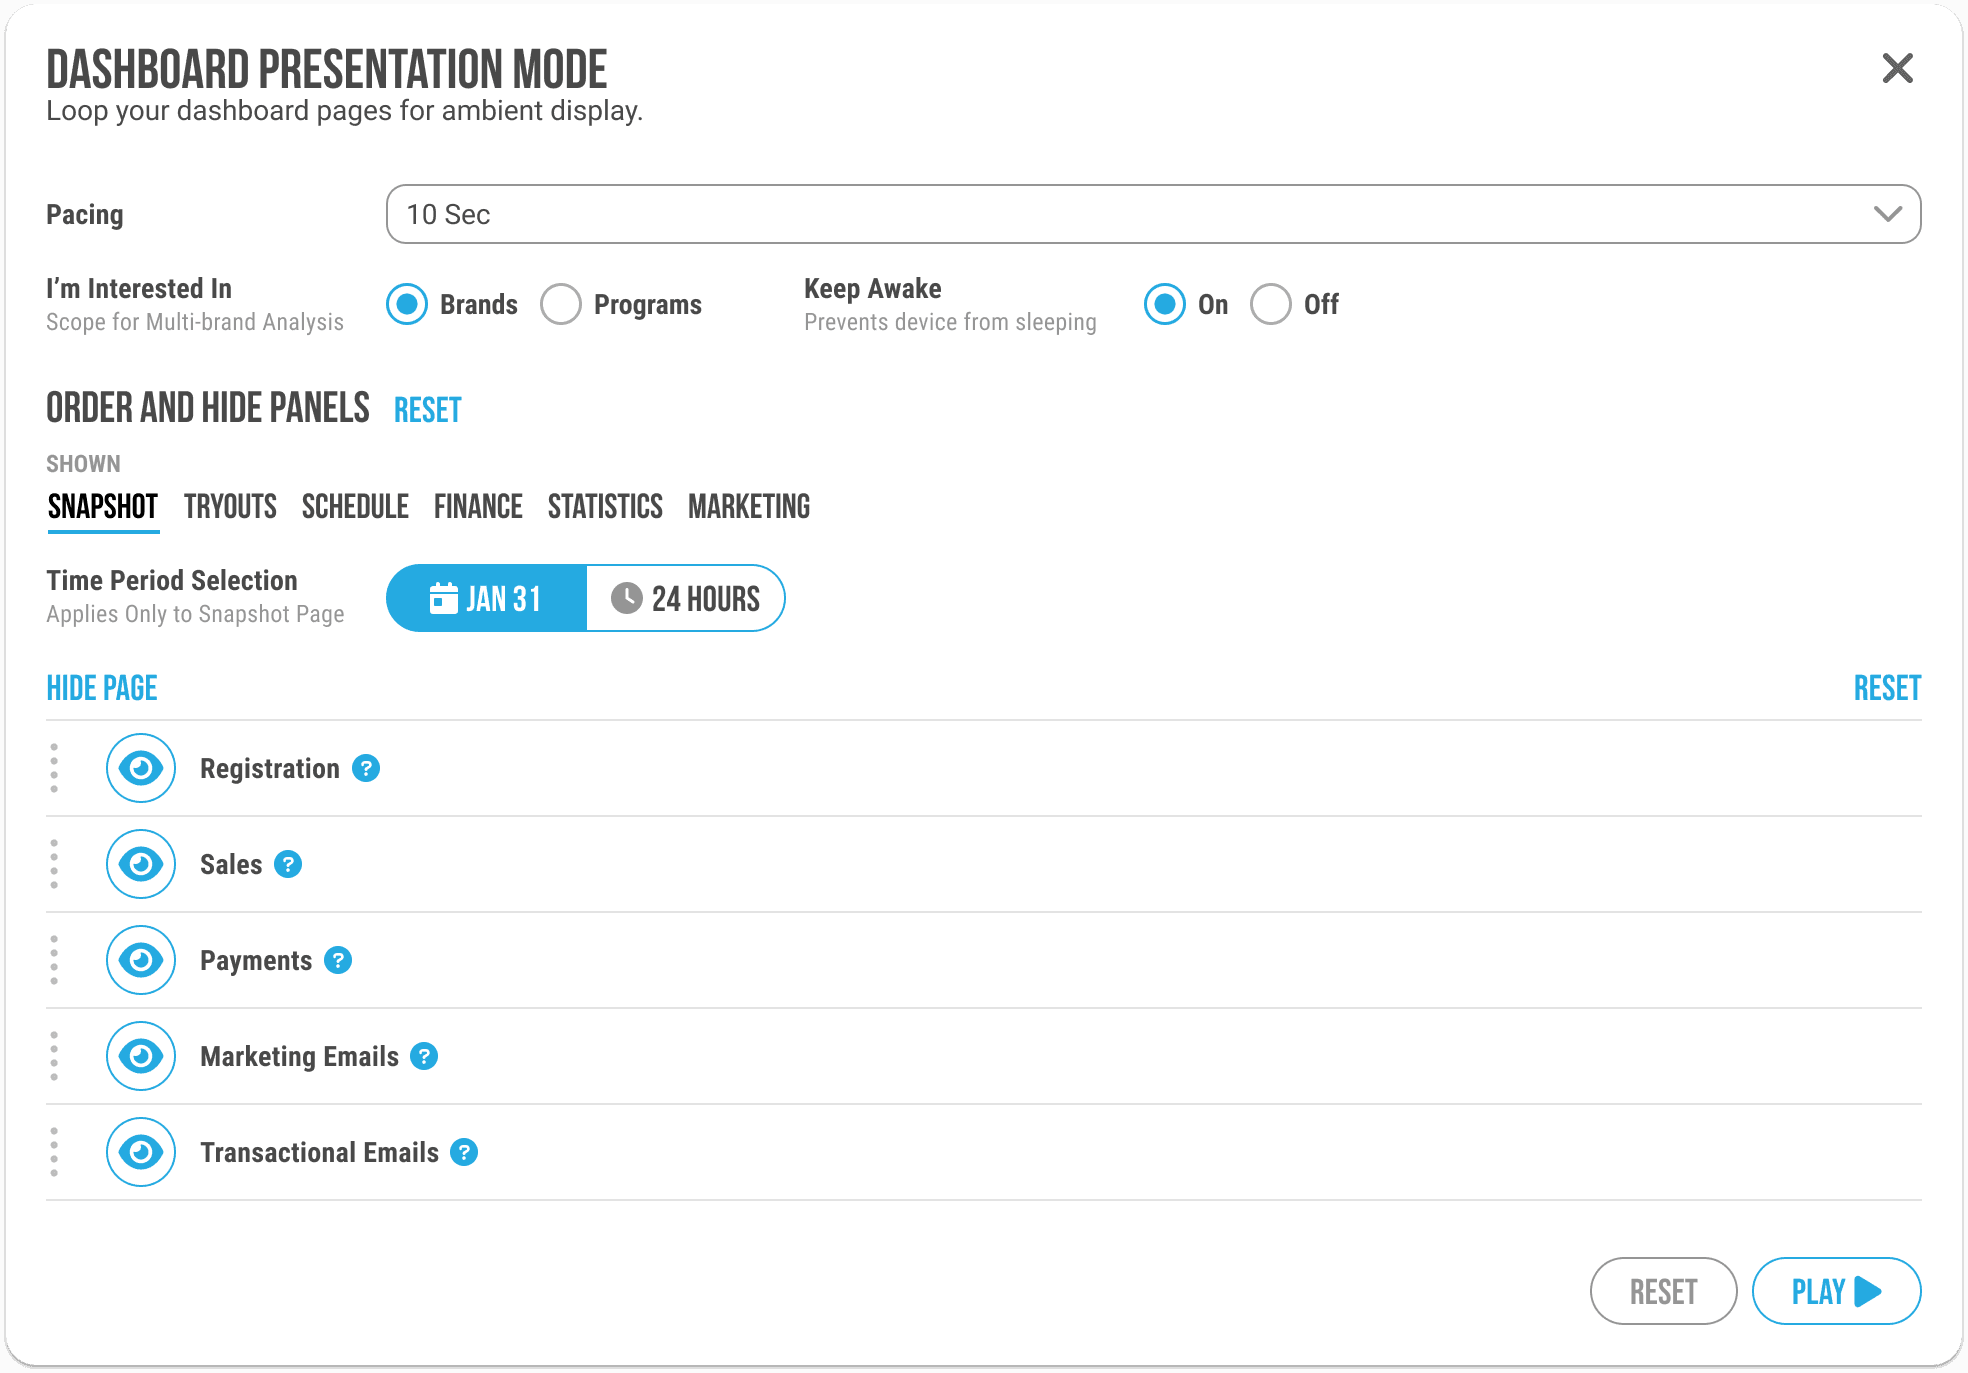
Customizing the TV Display
When a user clicks the TV display button from the dashboard, they are presented with a modal to set which tiles or whole pages appear in the presentation.
Standardizing Valid Tile Layouts When Adding Flexible Tile Ordering
Since admin could customize which tiles appeared on each page, we could no longer rely on a fixed dashboard layout.
To address this, I categorized tiles into 3 types: two-third tiles, one-third tiles with 1 content block, and one-third tiles with 2 content blocks. As the three-column desktop grid condensed to a single column on mobile, I developed rules to ensure each tile type adapted seamlessly based on the available columns and other tiles in proximity.
One-Third Width Tiles Layout Options
I enumerated each valid 3 column layout for one-third width tiles with 1 content block vs 2 content blocks.
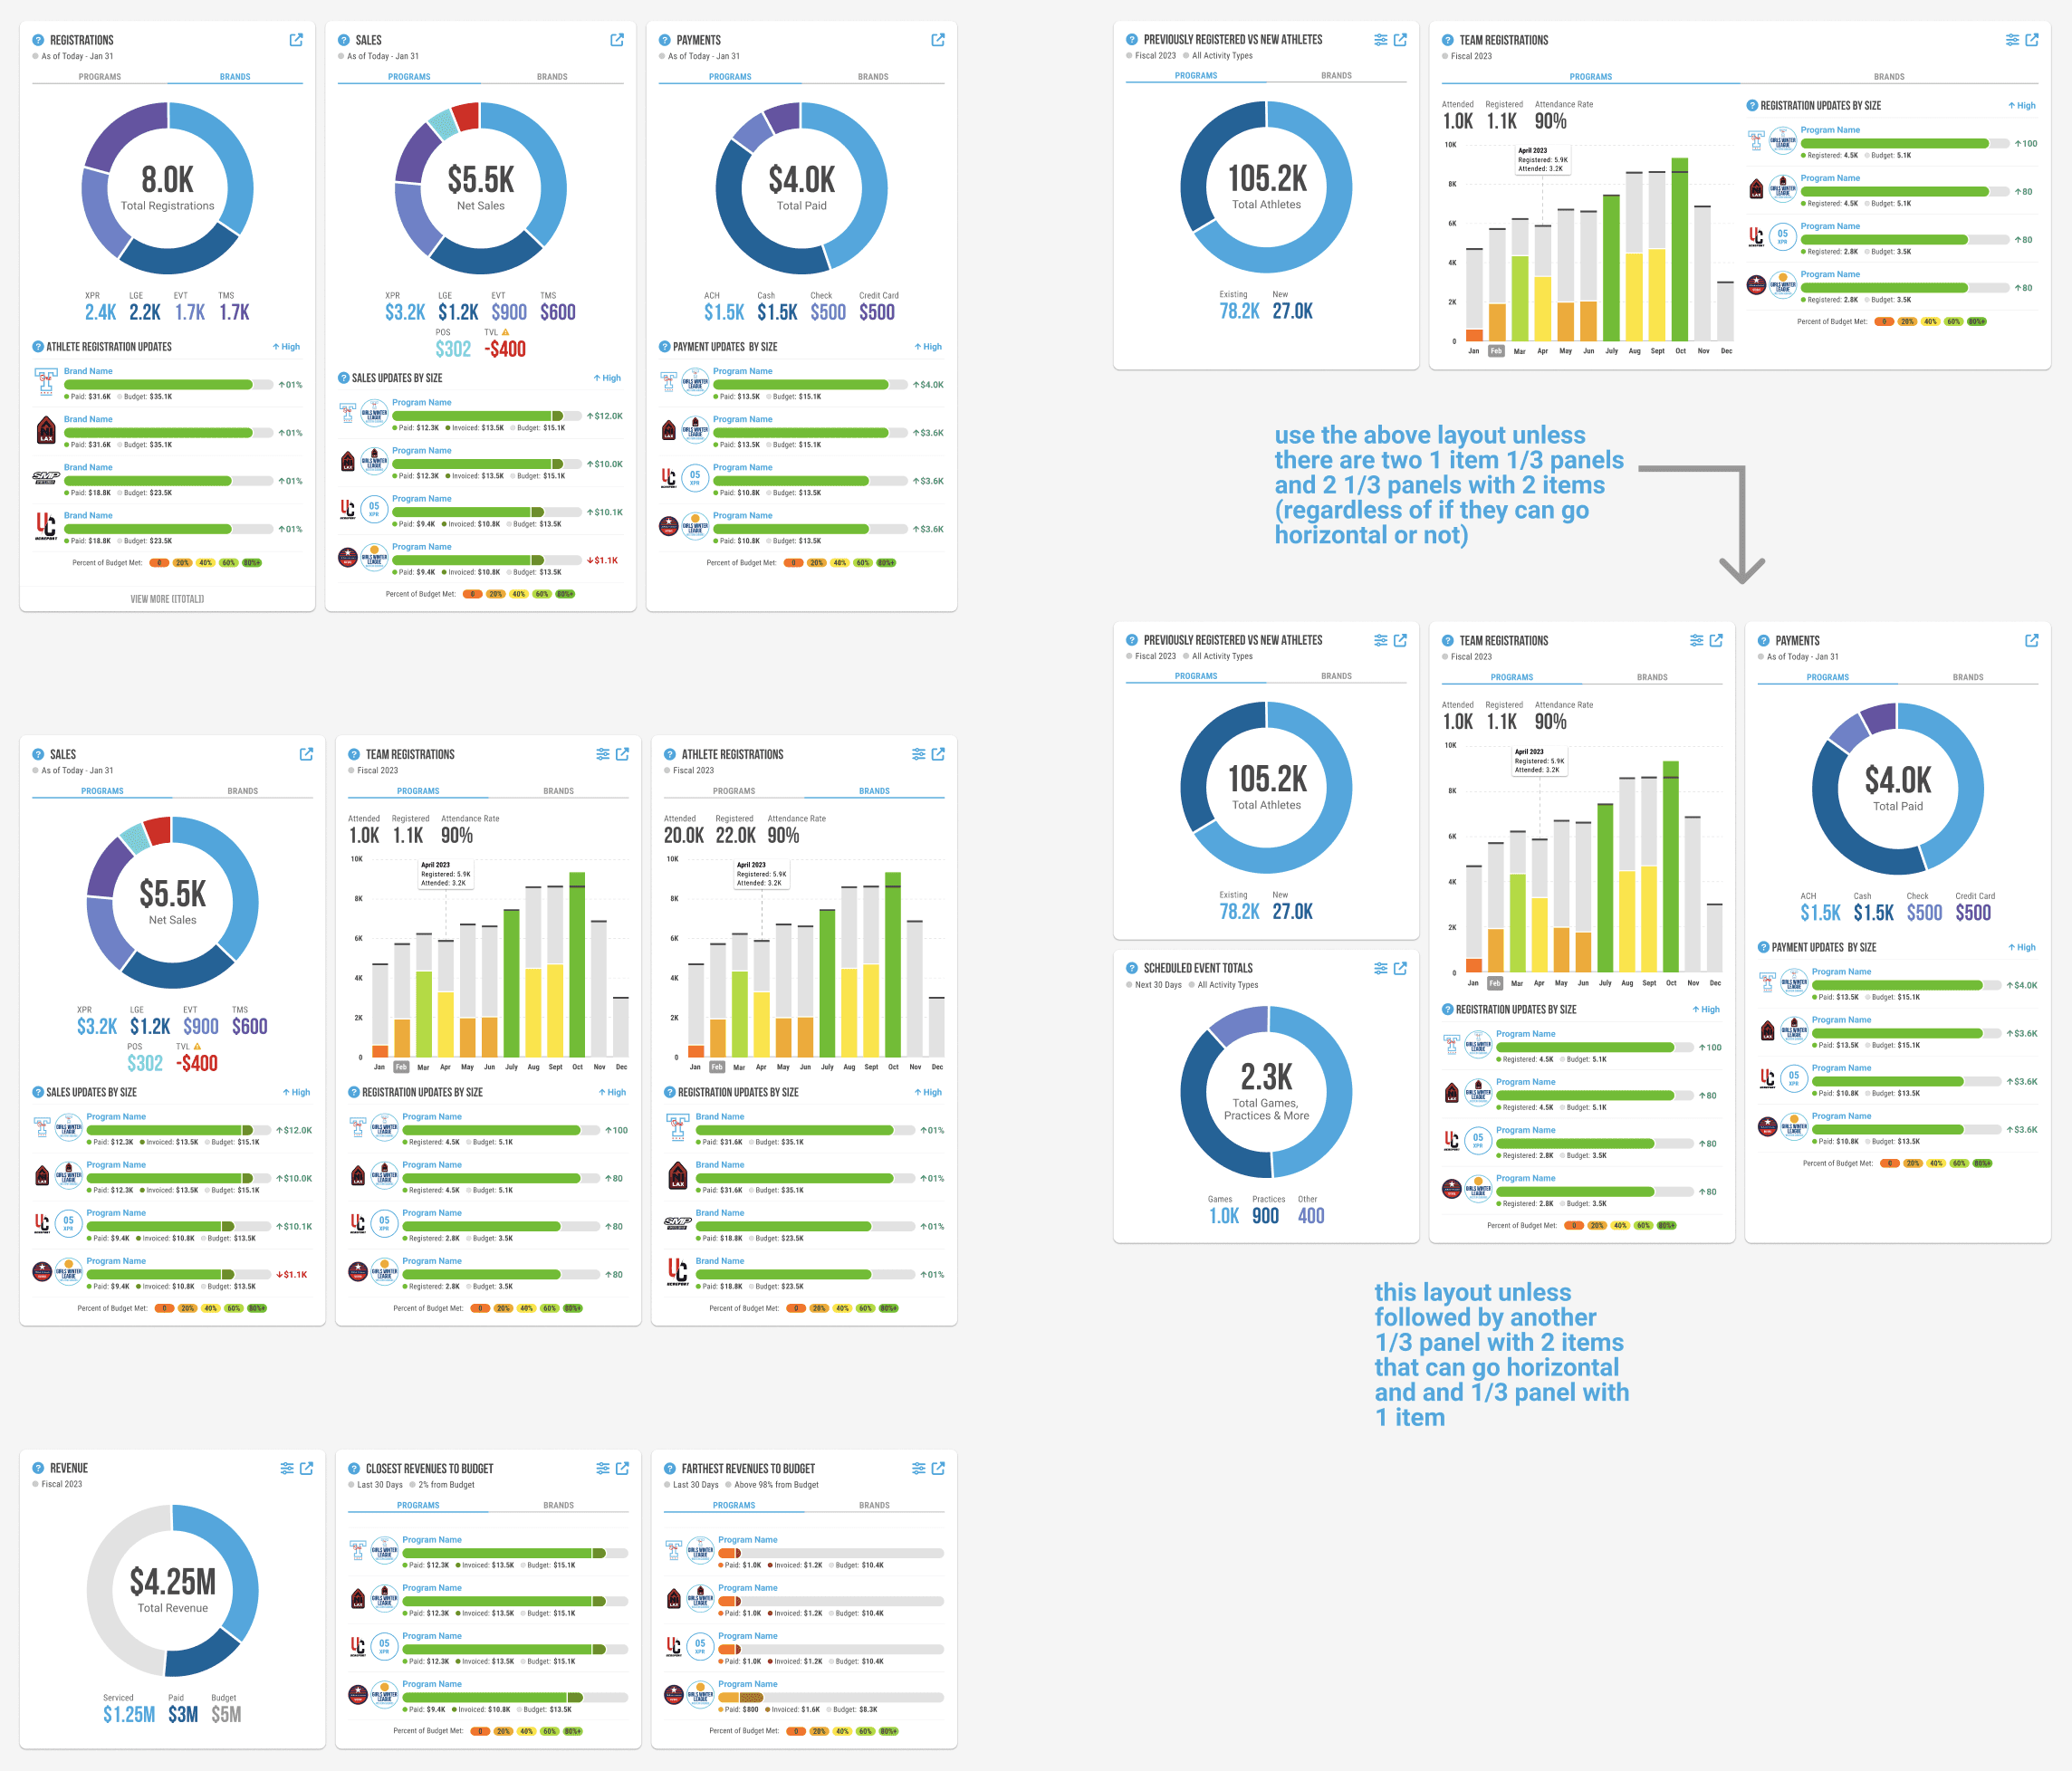
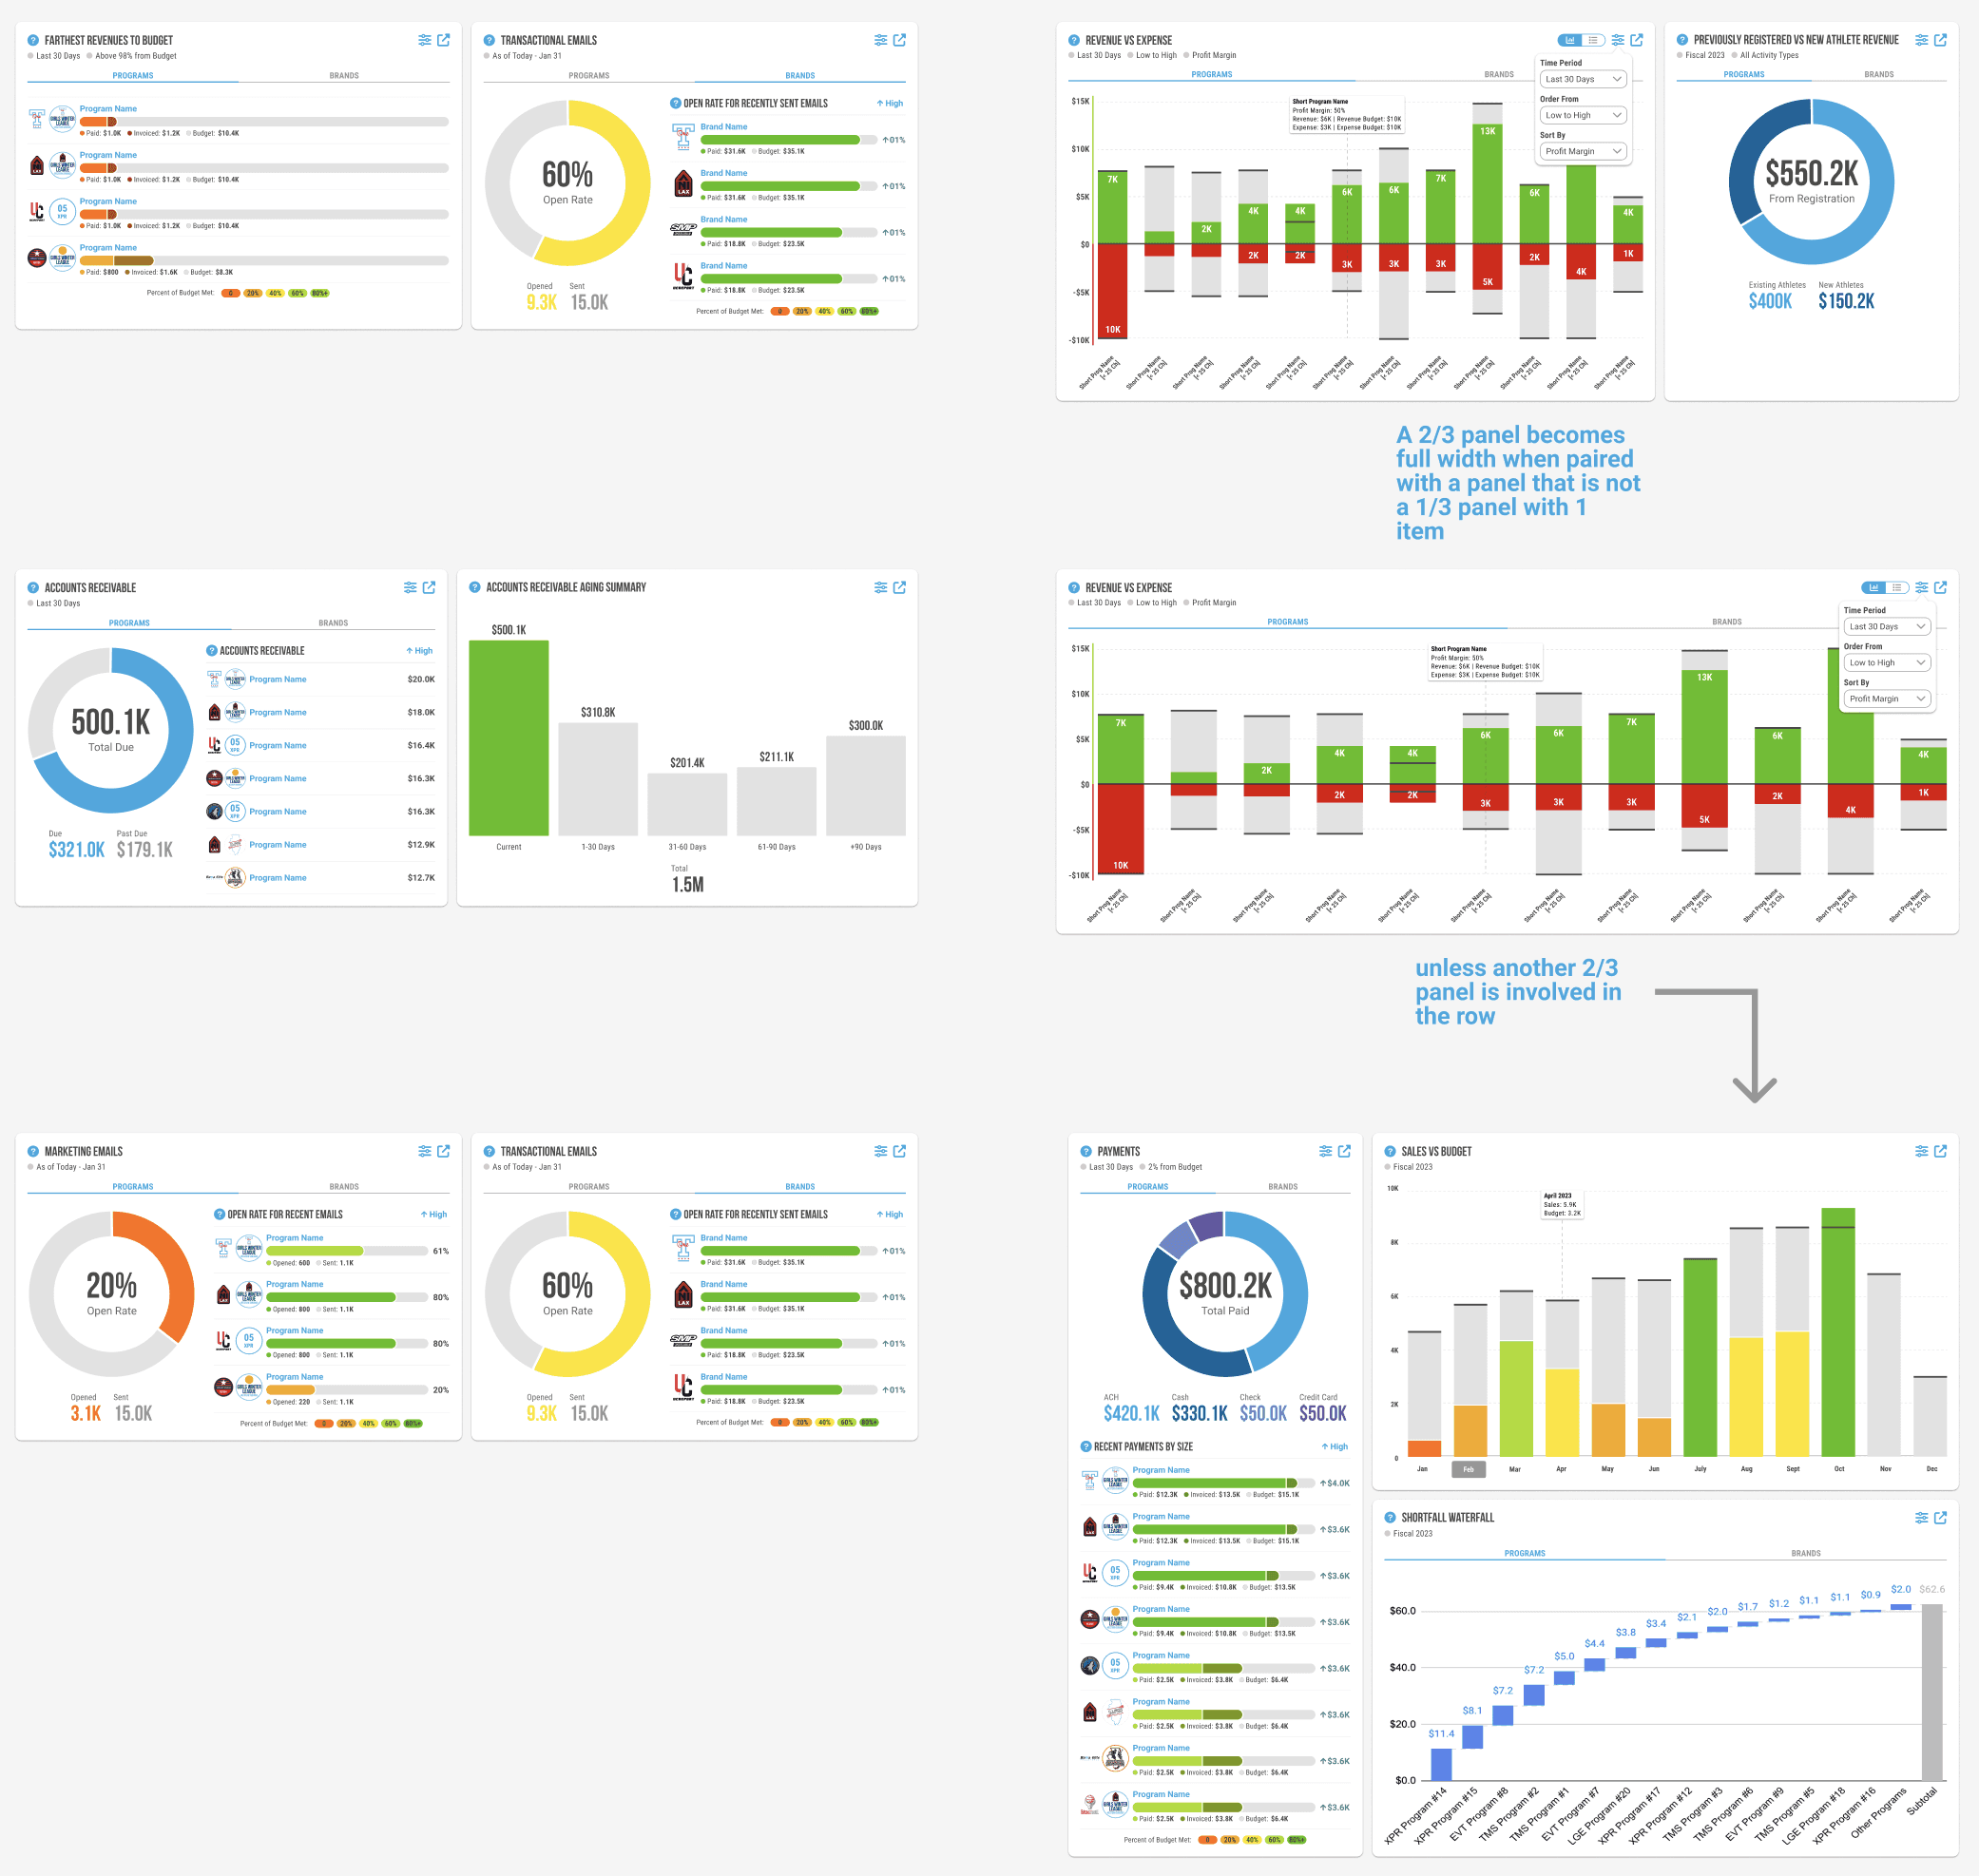
One-Third Width Tiles with Two-Third Width Tiles
I enumerated each valid layout when a one-third width tile with 1 or 2 content blocks is placed next to a two-third width tile.
Final Design
Dashboard TV Display
Discover the workflow for displaying the dashboard in presentation mode.
2 Geographical Analysis via Interactive Heat Map
Starting with a Google Maps Visualization
During the main dashboard project, I was tasked with creating a tile that would display where and when events related to an admin's athletic programs are occurring.
What started out as a last minute tile addition, grew to become a larger project as stakeholders realized the impact that geographical based insights could have within the dashboard.
Starting Point
Basic Google Maps Based Heat Map
This first iteration was meant to be placed in the schedule tab to visualize what events were occurring for the day. From this, we began exploring how the heat map could be leveraged to illustrate more compelling insights.
Investigating Analogous Workflow Examples for UI Insight
As we began our efforts to expand on the heat map, stakeholders informed me that future iterations would need to deliver insights by state, county, city, and zip code.
With this refined focus, I searched for inspiration to showcase these new insight contexts.
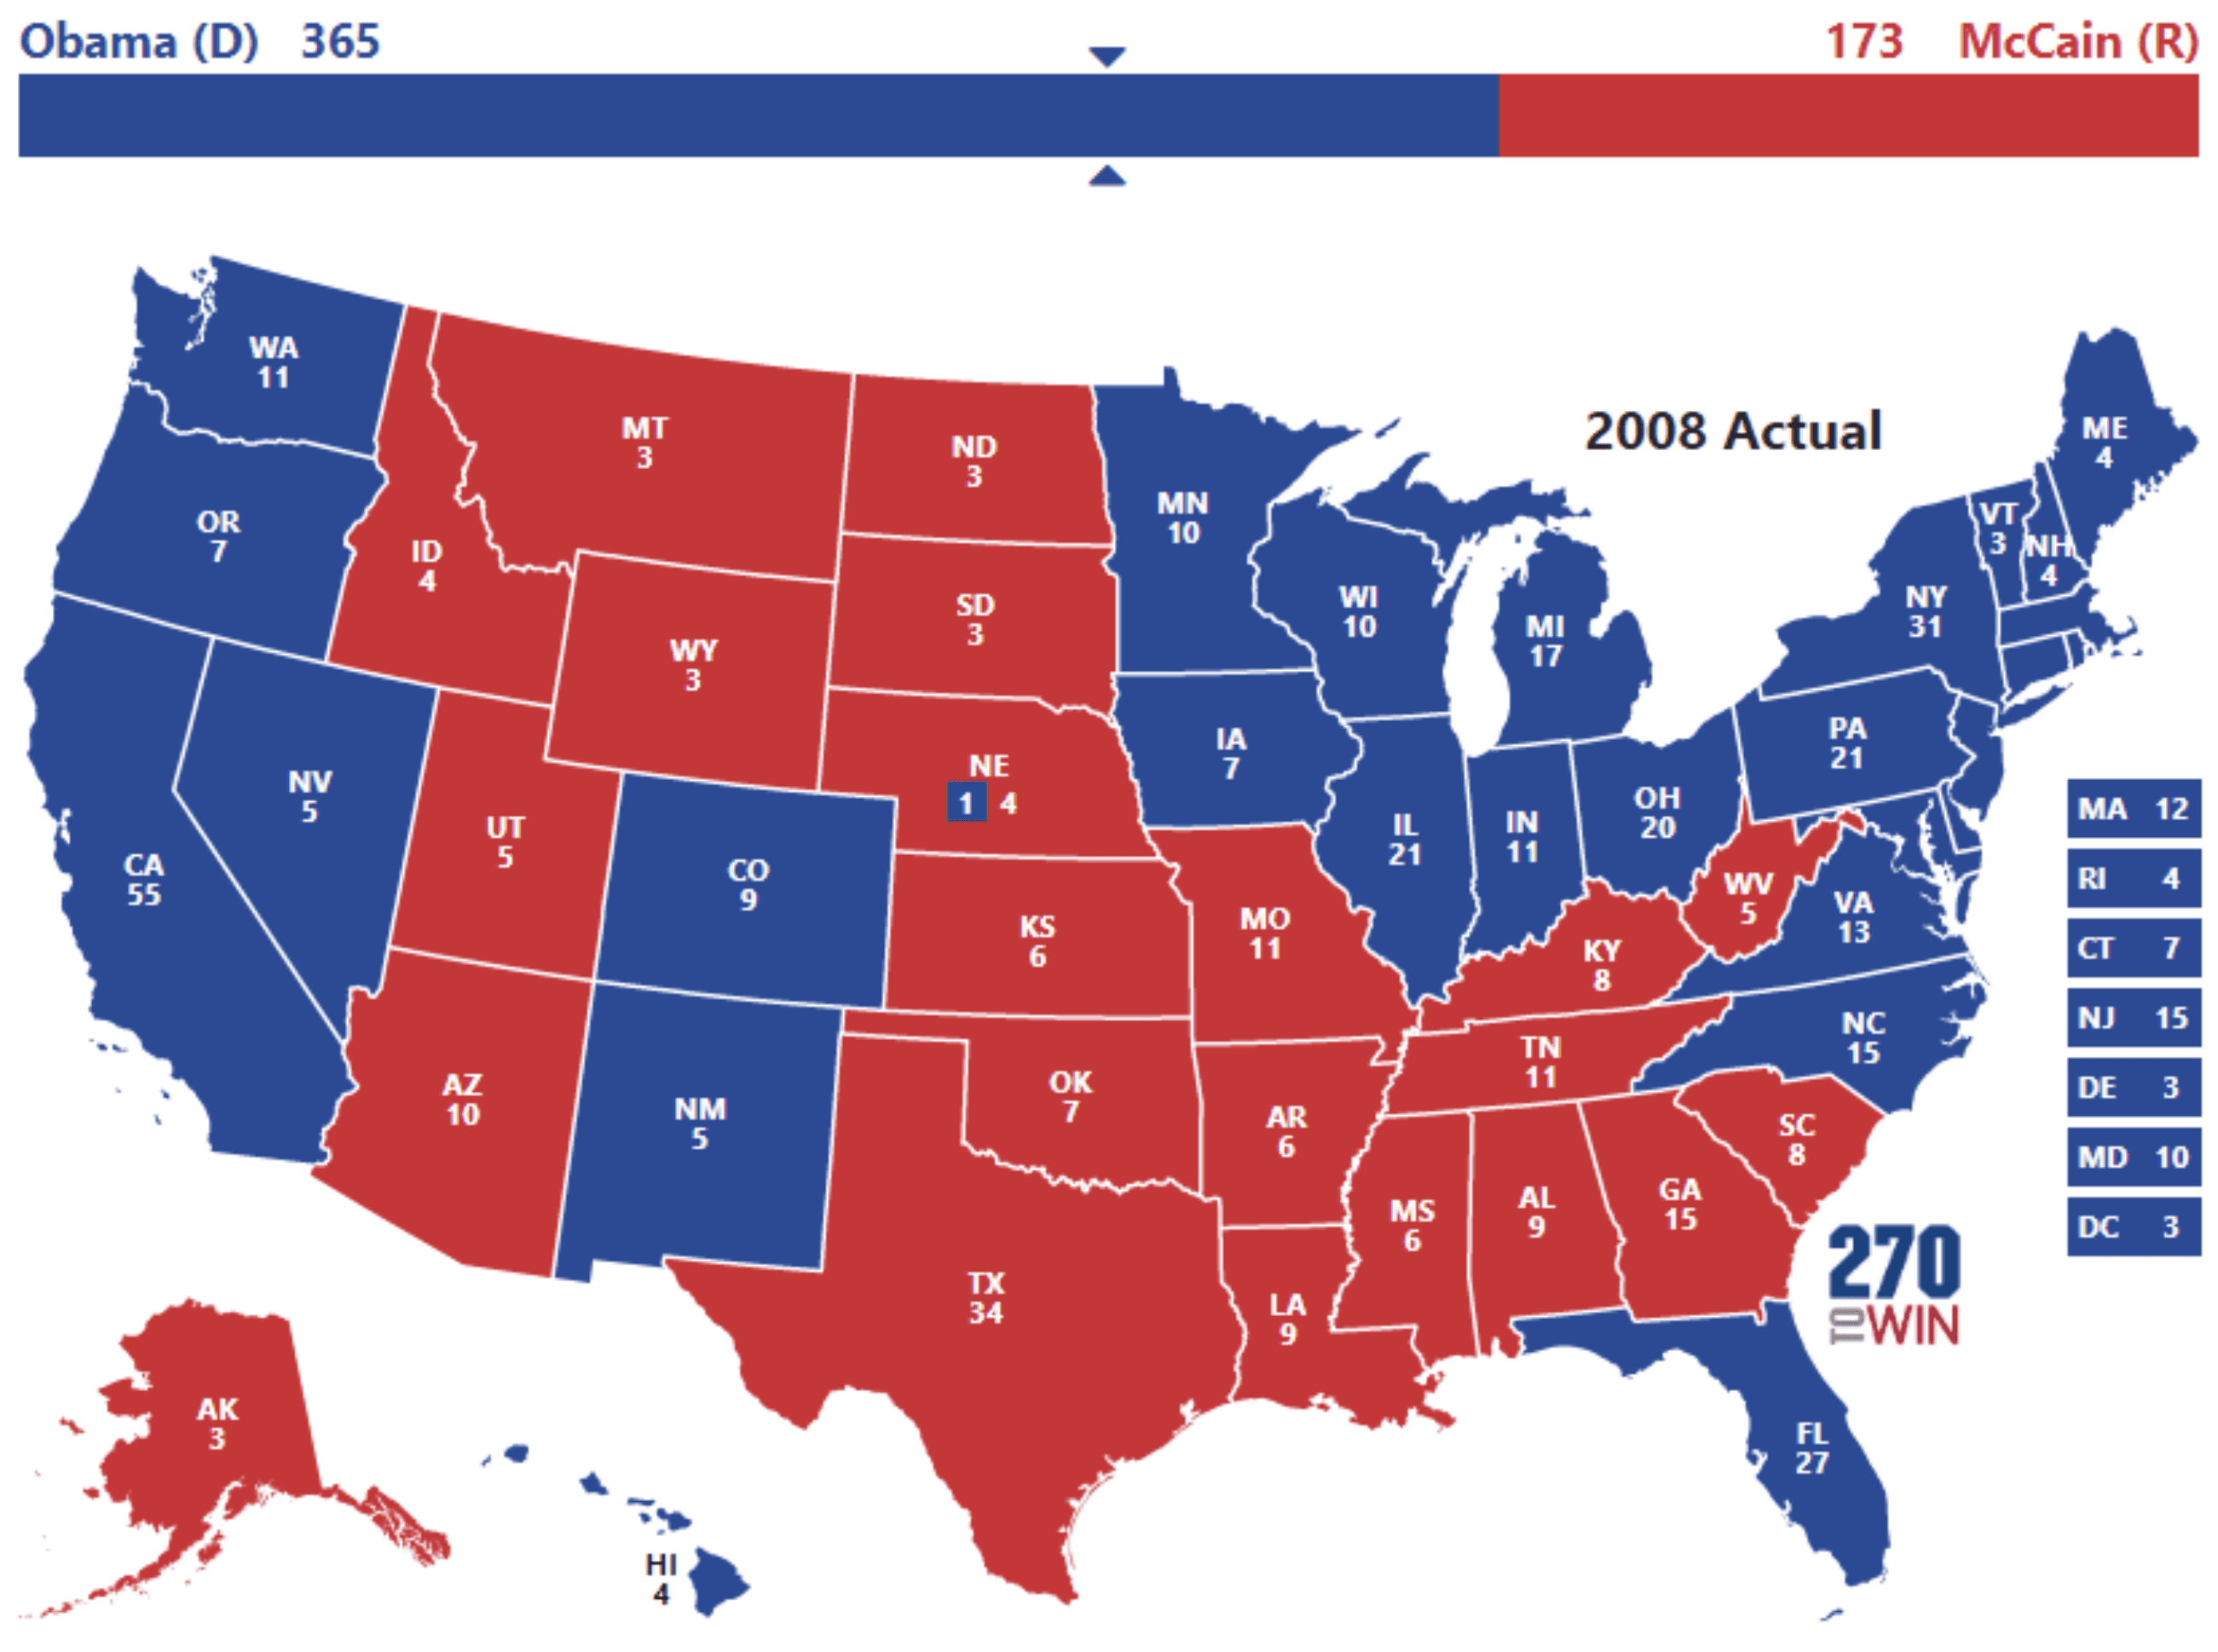
Mirroring the Electoral College Map for the Heat Map's Geographic Views
To illustrate insights at a national and state level, I mimicked the layout for the electoral college map. State and county data would be mapped and displayed on a color scale, created using the min and max of the dataset.

Comment Grouping in Figma for County, City, and Zip Code Views
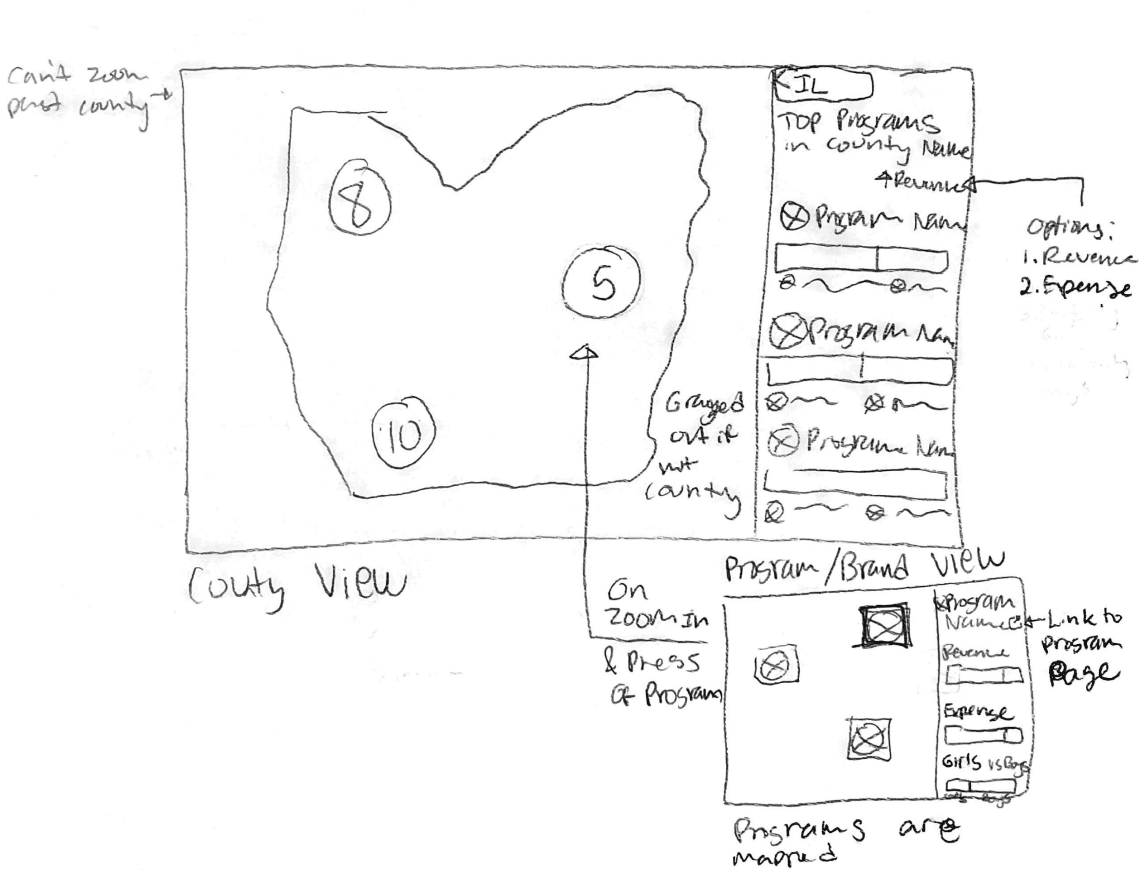
To illustrate insights within a county, city, or zip code, markers would showcase athletic organization's performance with color mapping. Closely placed markers would combine into group markers when zooming out, similar to how Figma's comments operate.

Combining Competitive Analysis into an Interactive Tile
With two ways of visualizing athletic organization performance, I sketched to visualize how the user would interact with the new heat map and transition between views.
To access a state view, click into the state from the US Map.
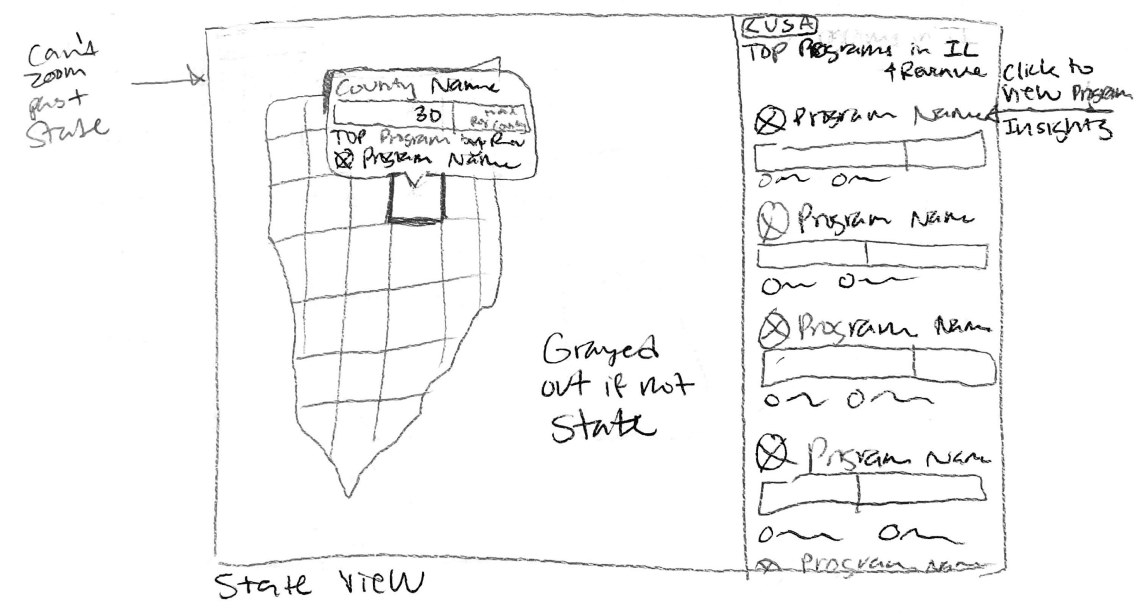
To access a county view, click into the county from the state map.
I later introduced a search feature to enable admin to study performance by city or zip code.
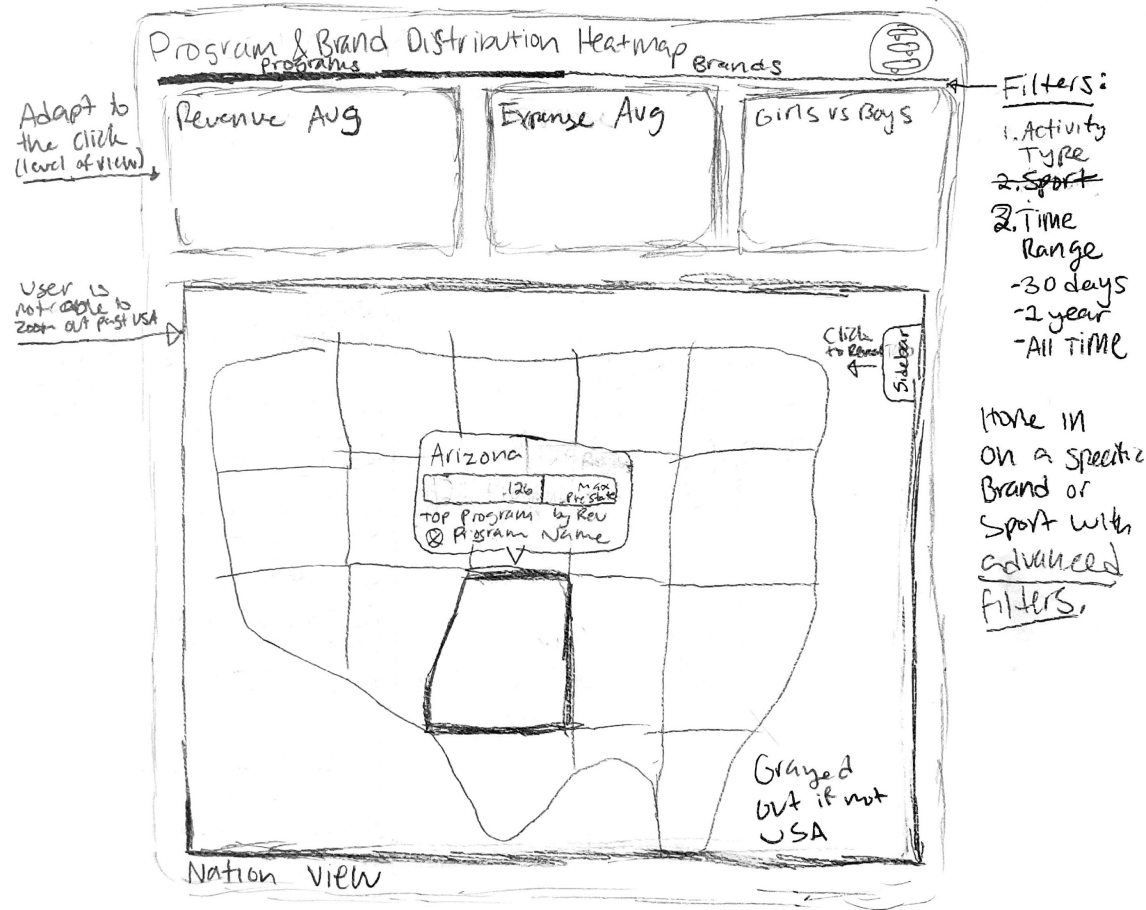
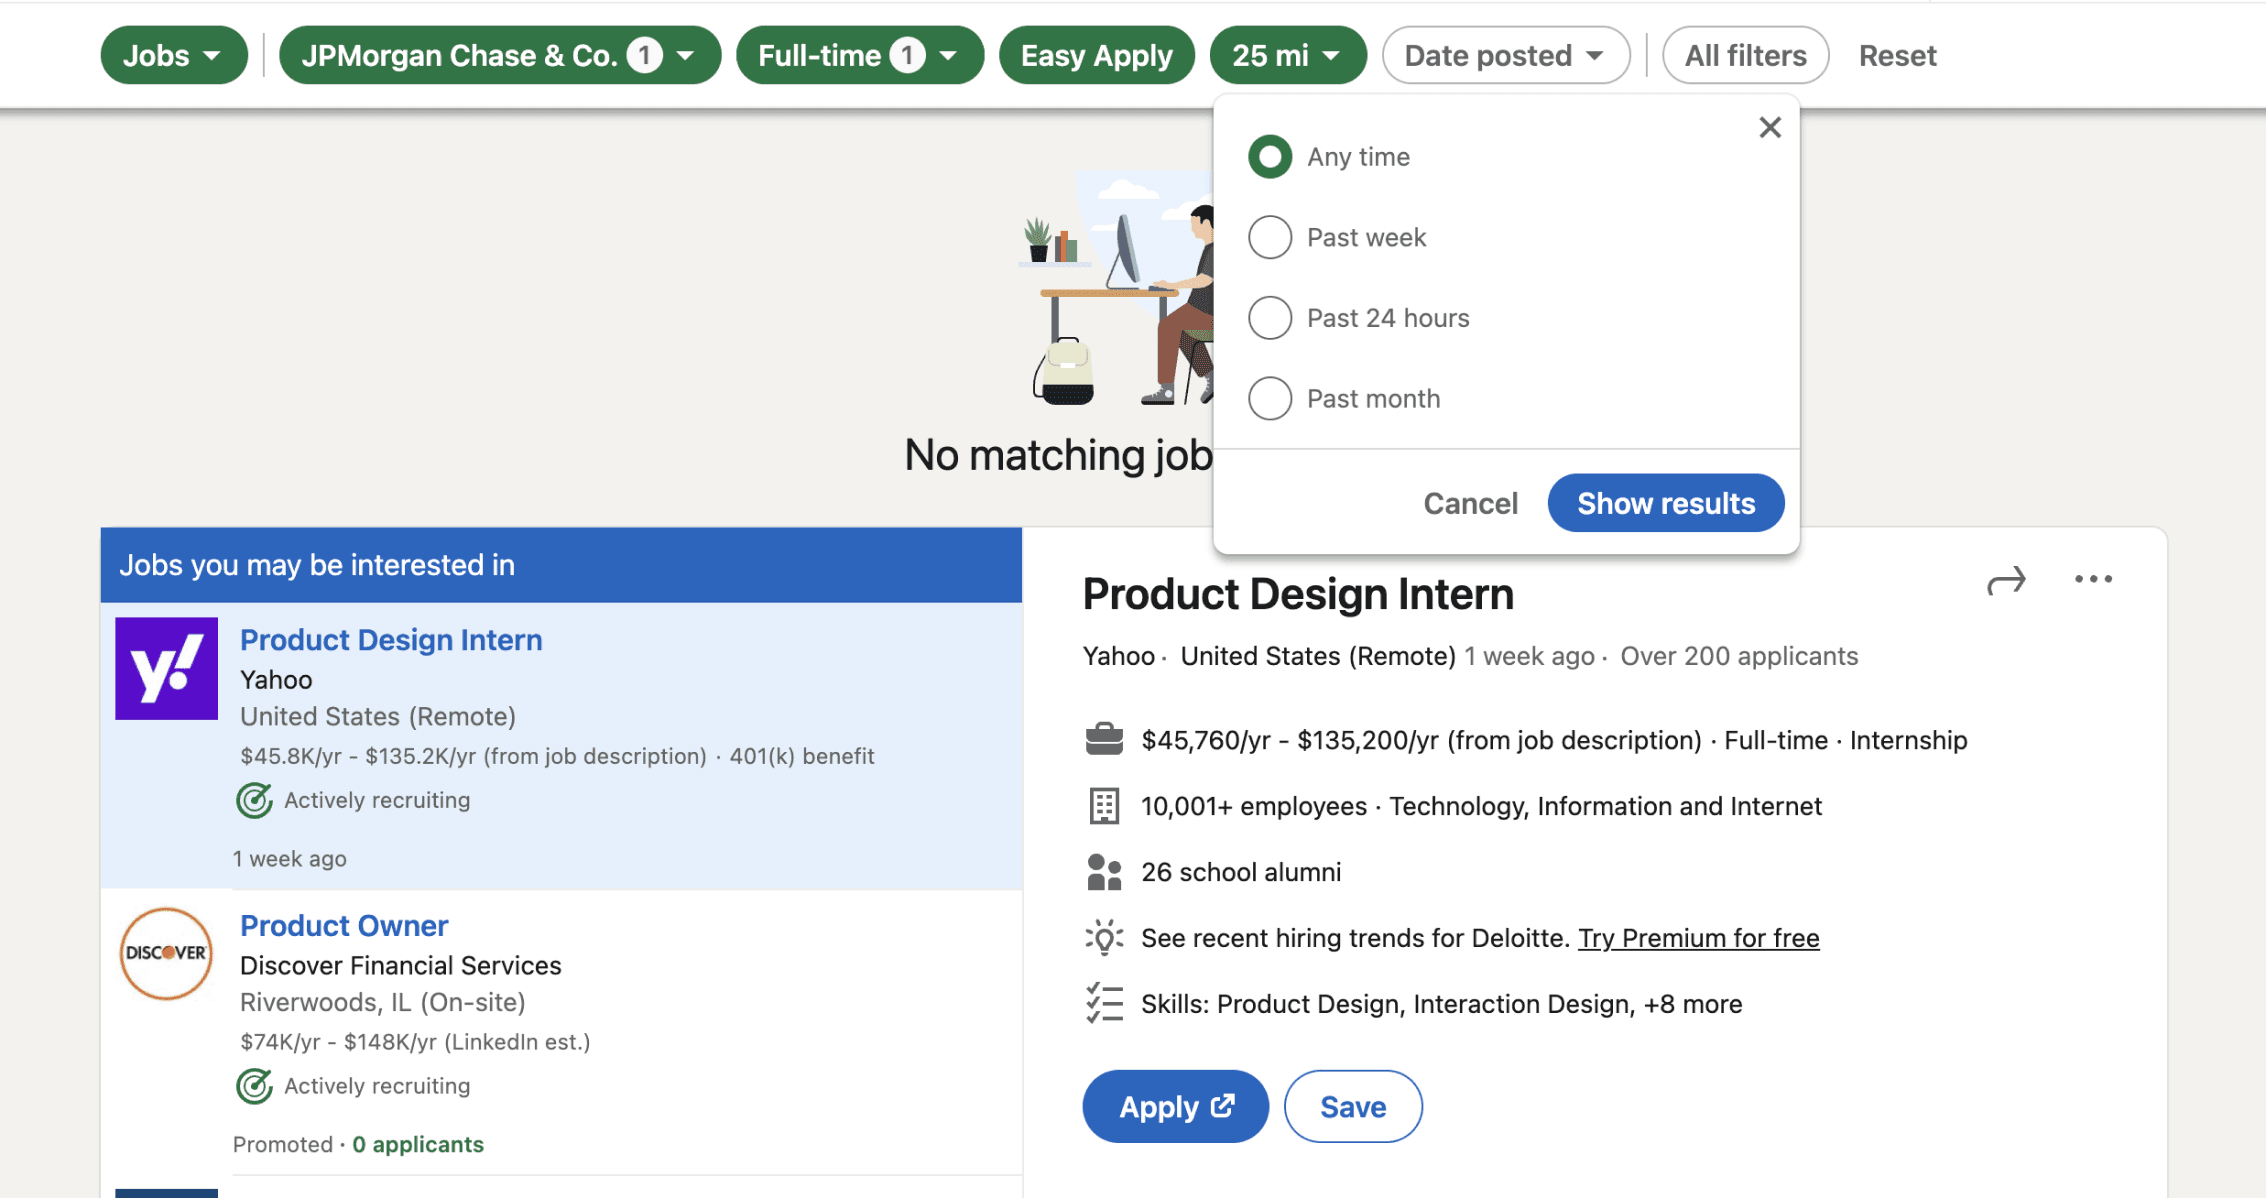
Mirroring the Extensive Filtering Mechanics in LinkedIn
As I planned to introduce a series of filters for data refinement, I looked towards LinkedIn's model of filtering, which highlights active filters but offers a range of auxiliary filters via All Filters. While we could not have our own All Filters panel due to technical limitations, we planned to show additional filters on scroll of the top filter navigation bar.
Creating High-Fidelity Components
With sketches reviewed by stakeholders, I began work on creating an interactive prototype of the heat map.
With the high-fidelity prototype, I explored how interactions with the side panel, color scale, and hover tooltip could better crystallize performance insights.
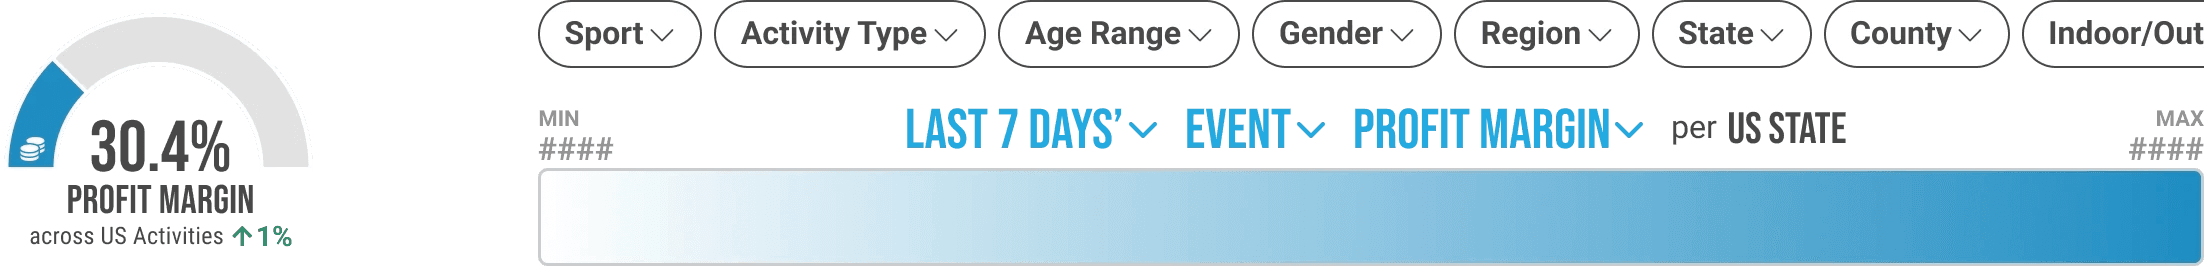
Color Scale & Filtering
I introduced a color scale to directly connect the shading in the heat map with the performance insights. Major filters can be adjusted within the color scale label, while minor adjustment filters are available above. These placements were meant to convey a clear hierarchy.
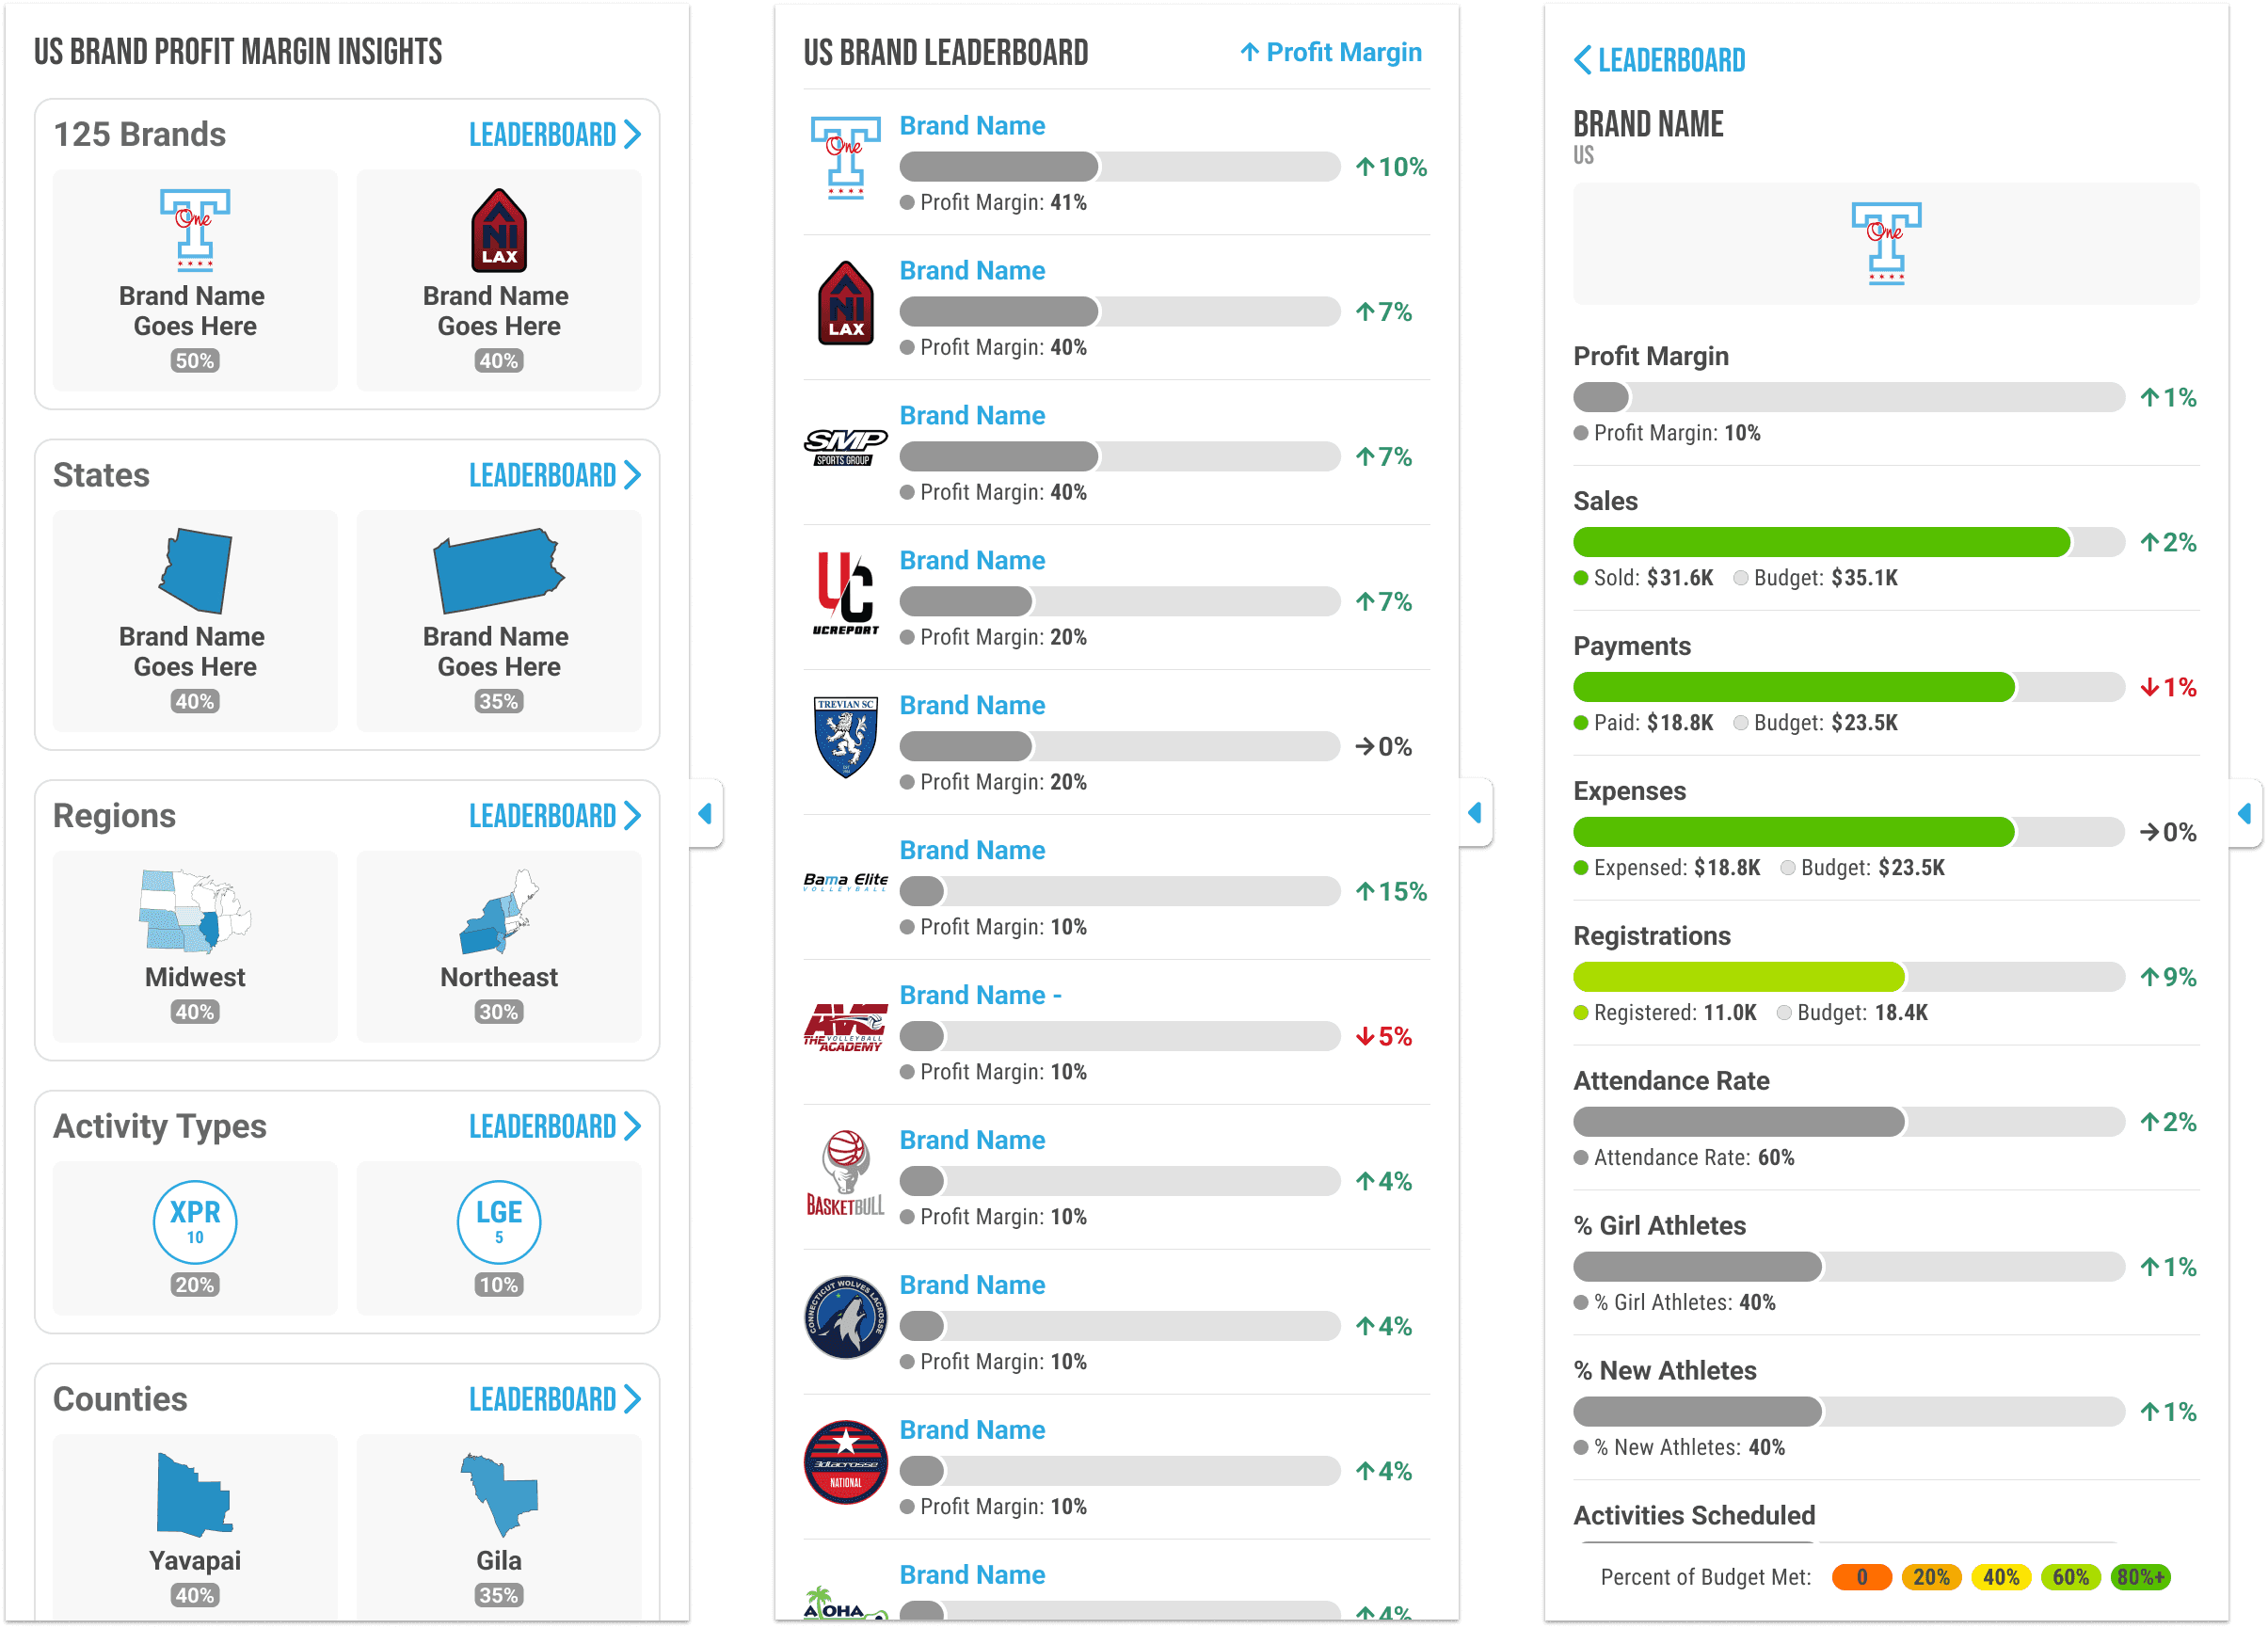
Side Panel
The side panel annotates the map by showing performance via leaderboards or individual organization profiles.
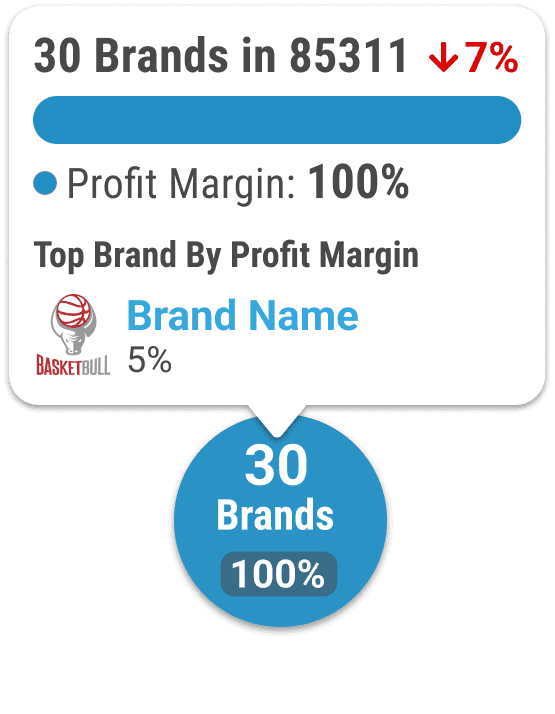
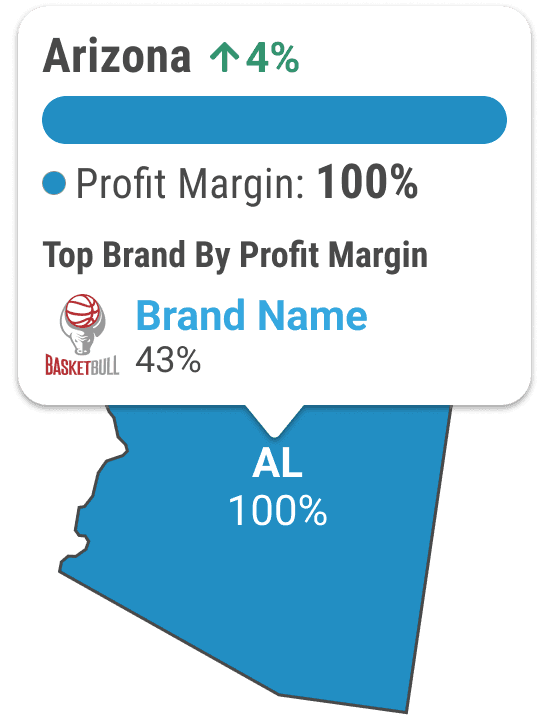
Hover Tooltip
A tooltip appears on hover of a state, county, or marker to clearly label the performance using a bar chart.
Final Design
After 2 months of agile design, while simultaneously finalizing the dashboard, the final heat map provides geographical insights into organizational performance by state, county, city, and zip code.
The color scale, leaderboards, and tooltips annotate the heat map to ensure insights are presented clearly and with context.
3 Feedback & Results
A Successful Dashboard to Orient Sports Admin
With designs confirmed by stakeholders, UX worked closely with development teams to ensure alignment on actualizing each visualization's design specifications across screen sizes and data states.
Upon delivery to brands, admin felt more in control of the different facets of their organization with the dashboard at their fingertips.

"Opening up my PlayerFirst account to the detailed reports shown in the dashboard makes me feel empowered to create effective change within my organization."

"The dashboard comprehensively summarizes registration, scheduling, financials in a scannable fashion. The Snapshot page keeps me sane!"

"The heat map is a versatile tool to study my brands across the US. We have our hands in so many pots so it's really helpful to zoom in and out on our multi-faceted organization."